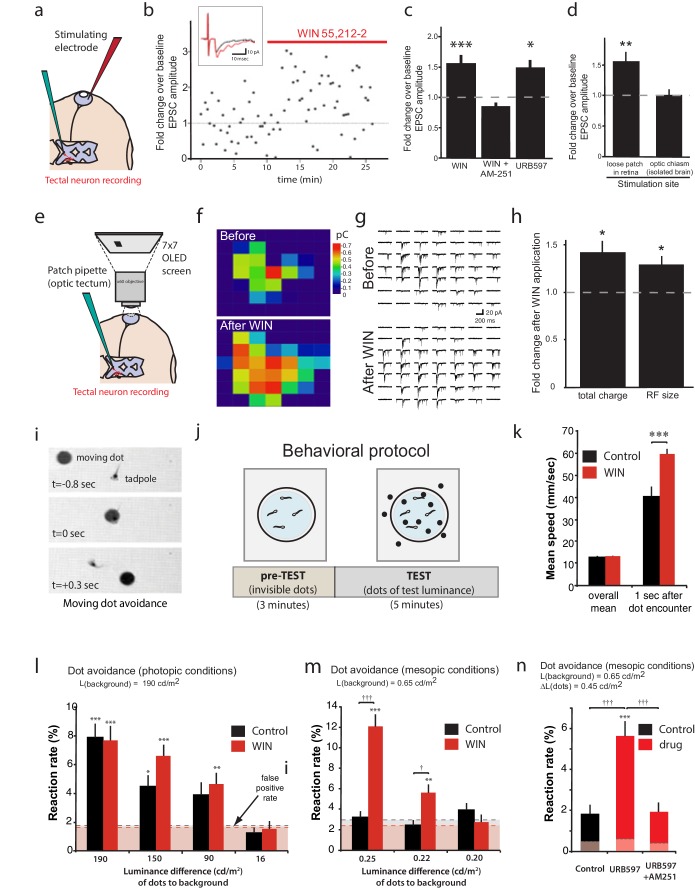
Figure 8. CB1R activation increases retinal inputs onto tectal neurons, expanding their input RFs, and enhances performance in a visual detection task.
(a) Schematic of in vivo amphotericin-perforated patch recordings of tectal neurons with extracellular electrical stimulation in the retina. (b) Peak retinotectal EPSC amplitudes show an increase induced during perfusion of WIN 55,212-2 onto the tadpole (red line) in a representative experiment. Inset illustrates recording traces before (black) and after (red) drug. (c) The increase in retinotectal EPSC amplitude by WIN 55,212-2 (n = 11) was blocked by AM-251 (n = 5). Elevating endogenous AEA using URB597 (n = 7) similarly enhanced EPSC amplitudes. (d) An isolated brain preparation (n = 7) in which the eyes are not present and retinotectal axons are stimulated directly at the chiasm did not show EPSC enhancement following WIN 55,212-2 application, indicating a retinal site of action. (e) Tectal RF mapping was performed by projecting visual stimuli from a small OLED video monitor onto the retina through the microscope objective while recording from tectal neurons. (f) Example color coded RF maps of integrated postsynaptic charge evoked by OFF stimuli presented in a 7 × 7 grid of visual fields before and after WIN 55,212-2 application reveal an expansion of the RF. (g) Sample traces of the compound synaptic currents used to generate f. (h) Total postsynaptic charge evoked by stimulating at each field of the grid, and the mean sizes of tectal cell RFs both increased in response to WIN 55,212-2 application (n = 5 animals). (i–n) Visually guided escape behavior analysis (i) Avoidance response of a free swimming tadpole to a dark moving dot. (j) False-positive rate was measured during a 3 min pre-TEST where dots possess the same luminance as the background ('invisible dots'); this was followed by a 5 min TEST period with dots darker than the background. (k) WIN 55,212-2-treated tadpoles swam at the same speed as control tadpoles prior to encountering dots, but swam away faster following an encounter. (l) The probabilities of eliciting avoidance reactions to dots presented at a range of contrasts on a bright background (luminance: 190 cd m-2) did not differ between control (n = 24) and WIN 55,212-2-treated (n = 24) tadpoles. (m) Dark dots moving on a dim background (luminance: 0.65 cd m-2) led to avoidance reactions in WIN 55,212-2-treated (n = 24), but not control (n = 24), tadpoles. (n) URB597-treated tadpoles (n = 24) also reacted with higher rates than matched control animals (n = 24). This was prevented by blocking CB1Rs with AM-251 (n = 24). Reaction rates represent the average fraction of encounters with dots per tadpole that resulted in a change in swimming velocity (>24 mm s−1) In l, m and n horizontal dashed lines represent mean false-positive reaction rates measured pre-TEST using 'invisible dots'. (c,d,k) *p<0.05, **p<0.01, two-way RM ANOVA with Holm-Sidak posttest. (h) *p<0.05, one-sample t-test vs. pre-drug baseline. (l-n) †††p<0.001 two-way ANOVA with Holm-Sidak post-hoc tests comparing control and drug-treated groups, ***p<0.001; **p<0.01, *p<0.05 compared to pre-TEST false-positive rates. AEA, anandamide; EPSC, Excitatory postsynaptic current; RF, Receptive field.


