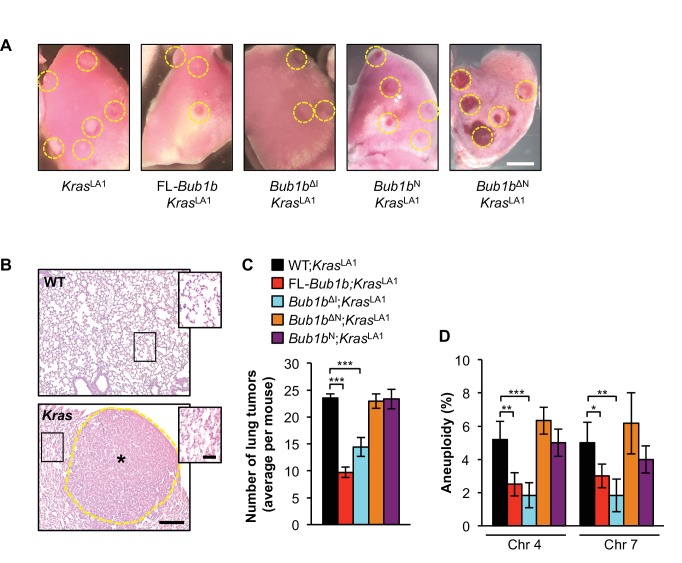
Figure 2. Select BubR1 domain overexpression protects against aneuploidy and cancer.
(A) Lung lobes of KrasLA1 mice and KrasLA1 mice expressing various BubR1 transgenic proteins sacrificed at 6 weeks of age. Entire lungs were inspected using a dissection microscope to quantitate the number of lung tumors (adenomas) per mouse. (B) Hematoxylin-eosin stained lung sections of representative normal (WT) lung and a KrasLA1 (Kras) hyperplastic tumor-bearing lung (the dashed line marks the adenoma boundary). Insets highlight normal and hyperplastic lung architecture. (C) Quantification of the number of lung tumors from mice shown in A. n = 20, except for full-length (FL)-Bub1b where n = 7. Data are mean ± s.e.m. ***p<0.001. (D) Interphase FISH on the lungs of wild-type and KrasLA1 with and without FL-BubR1 and mutant overexpression. n = 5, ≥ 100 cells per animal. Data are mean ± s.d. *p<0.05, **p<0.01. ***p<0.001. Scale bars: A, 2 mm; B, 200 µm (main image) and 50 µm (insets). (See associated Figure 2—source data 1).
DOI: http://dx.doi.org/10.7554/eLife.16620.011

