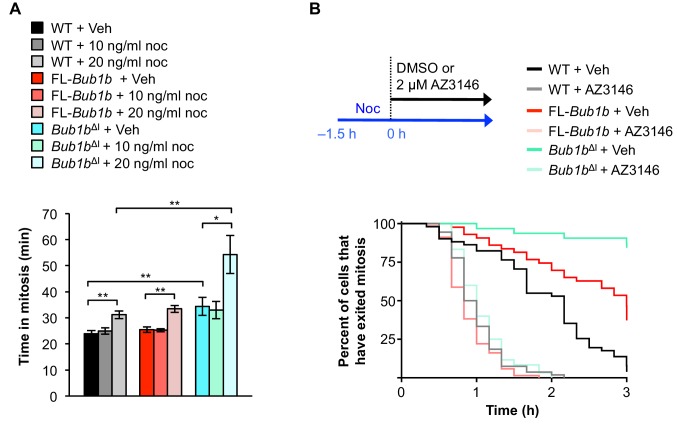
Figure 5. Bub1bΔI MEFs have a lower threshold to checkpoint activation.
(A) Analysis of the time from NEBD to anaphase onset in H2B-RFP MEFs of the indicated genotypes treated with either DMSO vehicle (Veh) or indicated concentration of nocodoazole (Noc). n = 3 lines, ≥ 20 cells per line. Data are mean ± s.d. *p<0.05, **p<0.01. WT, wild-type. FL, full-length. (B) (top) Strategy for analyzing the checkpoint silencing efficiency. MEFs of indicated genotypes were treated with 100 ng/ml nocodazole for 1.5 hr before addition of either DMSO vehicle (Veh) or 2 µM AZ3146, at which point cells were marked and monitored for time of escape (time point zero). (bottom) Analysis of duration of mitotic arrest from time point zero as outlined in (top). n = 3 lines, ≥ 20 cells per line. (See associated Figure 5—source data 1).
DOI: http://dx.doi.org/10.7554/eLife.16620.018


