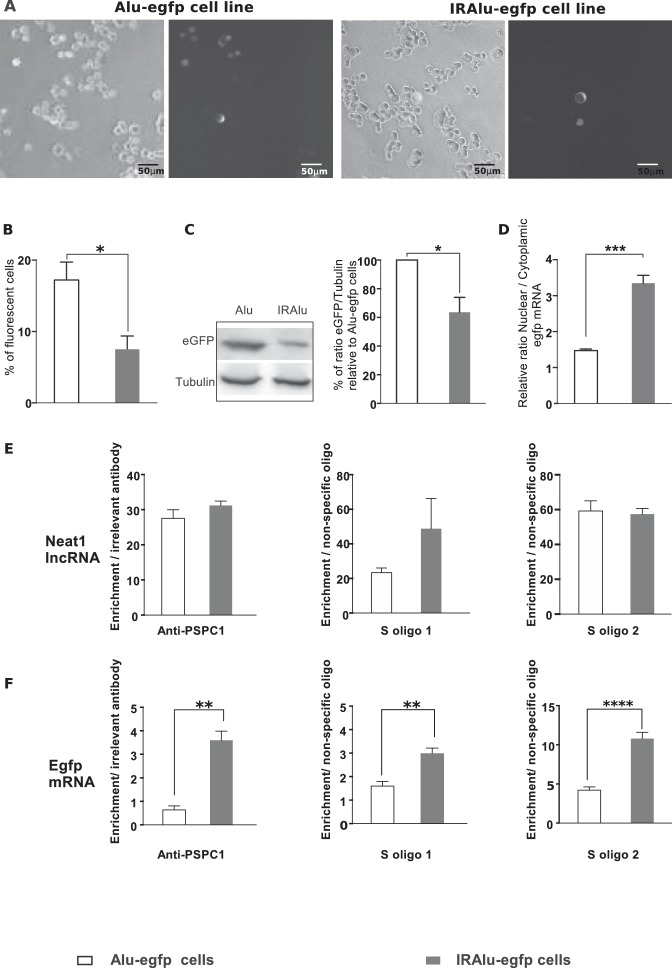
Figure 4. Influence of IRAlu elements inserted in 3'-UTR egfp mRNA.
(A–C) Decrease in EGFP expression by insertion of IRAlus in the 3’ -UTR of egfp mRNA. IRAlus and Alu were PCR-amplified from the 3’-UTR of Nicn1 and then inserted separately into the 3’-UTR of egfp mRNA. GH4C1 cell lines, Alu-egfp and IRAlu-egfp cell lines were established by transfection of the indicated plasmids. (A) Representative example of fluorescence and corresponding bright field pictures taken 48 hr after platting of each cell line. Scale bars equal 50 µm. (B) Quantitative analysis of the percent of fluorescent cells in each cell line. Data are means ± SEM of 18 measures performed in 3 independent experiments. (C) Quantification of relative levels of eGFP investigated by western blotting with anti-GFP antibody in total protein extracts from the two cell lines. Tubulin was used as the loading control. Data are mean ± SEM of values obtained from three experiments in IRAlu-egfp cell line and are expressed as a percent of the corresponding value obtained in Alu-egfp cell line. (D) Nuclear and cytoplasmic egfp mRNA were quantified by qPCR in each cell line and normalized to the relative amount of gapdh mRNA (n=8 for each cell line). Ratio of nuclear versus cytoplasmic egfp mRNA levels are compared between IRAlu-egfp and Alu-egfp cell lines. (E) Enrichment in lncRNA Neat1 after RNA Immuno-Precipitation (RIP) with an antibody directed against PSPC1 relative to an irrelevant antibody (left panel) or after RNA pull-down with two different specific biotinylated oligonucleotides (S oligo 1 and S oligo 2) relative to a non-specific oligonucleotide (two right panels). The relative enrichment in lncRNA Neat1 obtained after either RIP (n=3 for each cell line) or RNA pull-down (n=6 for each cell line) is not statistically different in Alu-egfp versus IRAlu-egfp cell lines F. Enrichment in egfp mRNA after RNA Immuno-Precipitation (RIP) with an antibody directed against PSPC1 relative to an irrelevant antibody (left panel) or after RNA pull-down with two different specific biotinylated oligonucleotides (S oligo 1 and S oligo 2) relative to a non-specific oligonucleotide (two right panels). The relative enrichment in egfp mRNA obtained after either RIP (n=3 for each cell line) or RNA pull-down (n=6 for each cell line) is statistically higher in IRAlu-egfp versus Alu-egfp cell lines. *p<0.05 **p<0.01***p<0.001****p<0.0001.
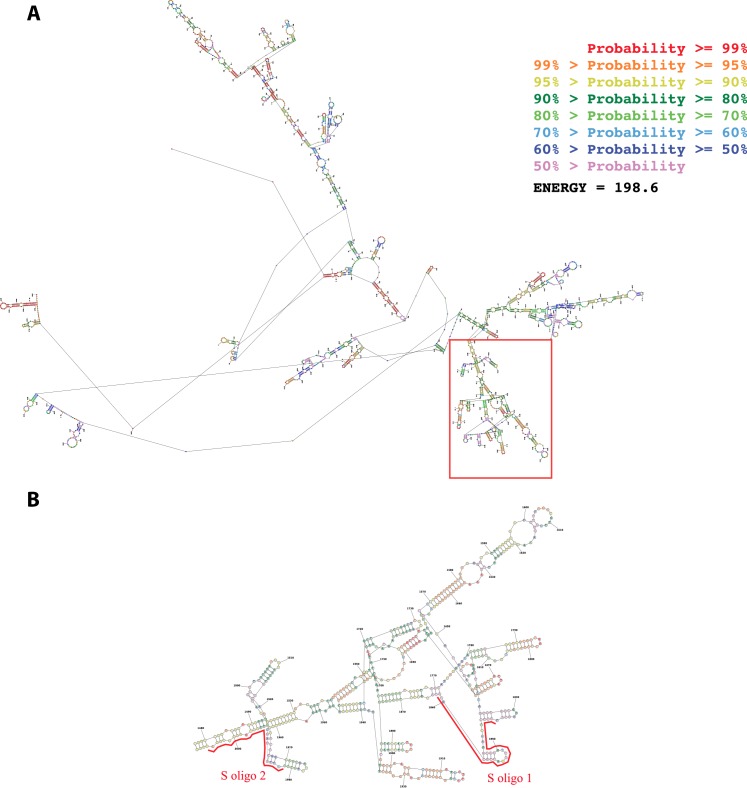
Figure 4—figure supplement 1. Secondary structure of the first 2500 nucleotides of the Neat1 RNA as predicted by MaxExpect software.
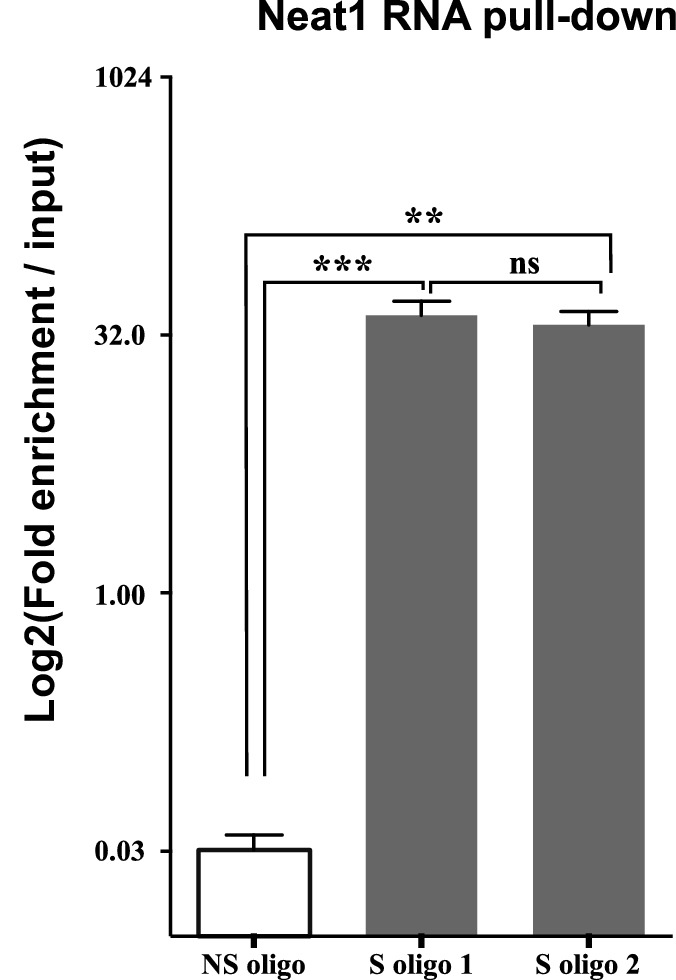
Figure 4—figure supplement 2. Enrichment of Neat1 RNA relative to input after RNA pull-down.


