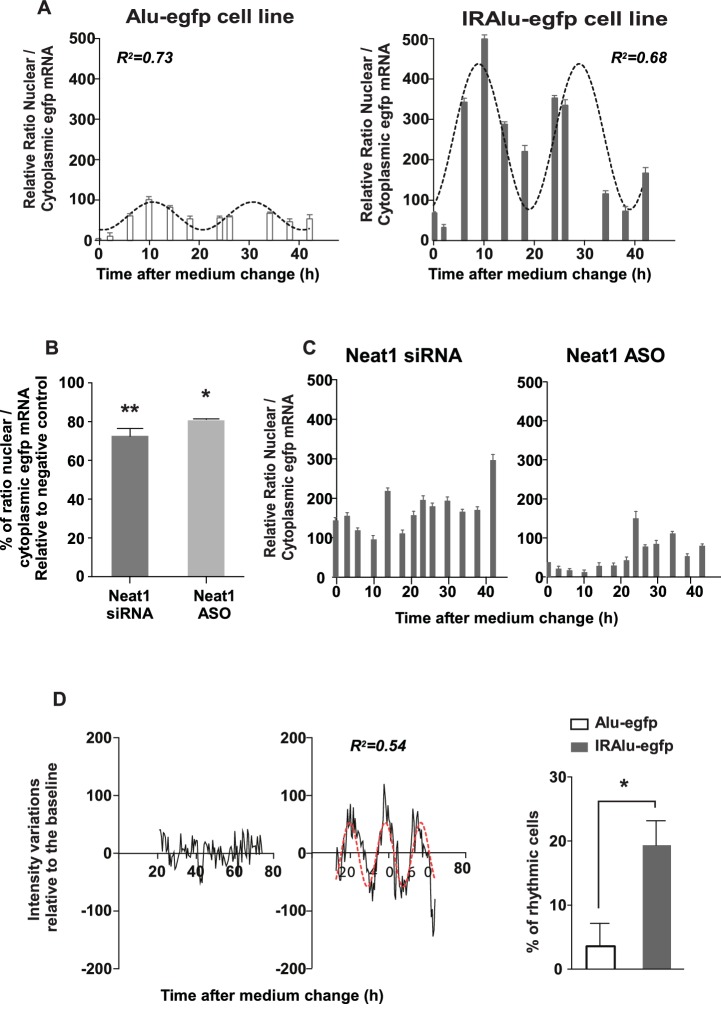
Figure 5. IRAlu element induced egfp mRNA circadian nuclear retention and EGFP circadian cytoplasmic expression.
(A) Rhythmic ratio of nuclear versus cytoplasmic egfp mRNA levels in Alu-egfp and IRAlu-egfp cell lines. Experimental values (n=3 for each cell line) can be adequately fitted (R2>0.55) with a non-linear cosinor equation in which the period value is set to 24 hr (see also Figure 5—source data 1). (B–C) Effects of paraspeckle disruption by Neat1 siRNA or Neat1 antisens oligonucleotides (ASO) on egfp mRNA nuclear retention in IRAlu-egfp cells. Nuclear and cytoplasmic egfp mRNA were quantified by qPCR in each condition and normalized to the relative amount of gapdh mRNA (n=2 for each condition). (B) Ratio of nuclear versus cytoplasmic egfp mRNA levels are compared between negative control and Neat1 siRNA or ASO *p<0.05 **p<0.01 (C) Loss of rhythmic egfp mRNA nuclear retention in IRAlu-egfp cells after Neat1 siRNA or ASO. Experimental values (n=2 for each condition) cannot be adequately fitted (R2<0.55) with a non-linear cosinor equation in which the period value is set to 24 hr. (D) eGFP fluorescence was recorded with real-time video microscopy in individual cells and values were fitted by a cosinor equation. Shown are examples of data from two cells that could not or could be fitted by cosinor equation, in left and right panels respectively. The percent of cells that could be fitted by cosinor equation with a R2 > 0.55 was then calculated for each cell line. This percent was significantly higher in IRAlu-egfp cell line compared to the Alu-egfp and egfp cell lines. *p<0.05
DOI: http://dx.doi.org/10.7554/eLife.14837.013


