. 2016 Jul 21;5:e14837. doi: 10.7554/eLife.14837

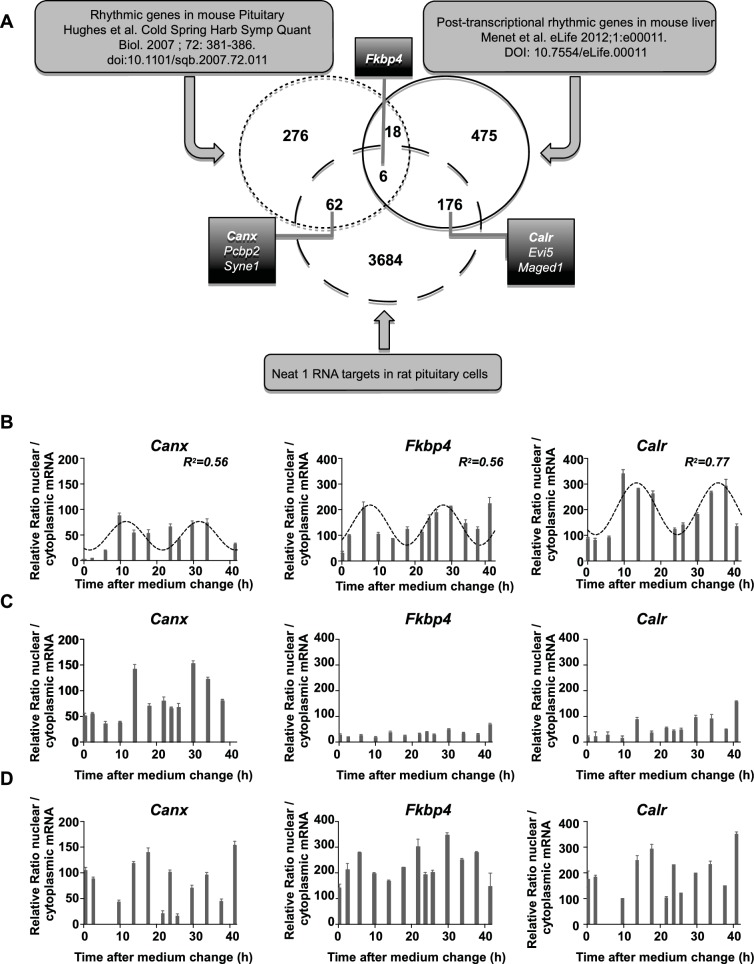
Figure 6. Characterization of paraspeckle-associated mRNA.

(A) Venn diagram representation of the overlap between transcripts linked to the paraspeckle (Neat1 RNA targets) with transcripts known as rhythmic genes in the mouse pituitary gland (Hughes et al., 2007) and/or post-transcriptional rhythmic genes in mouse liver (Menet et al., 2012). To allow comparison between lists from two different species, lists of genes were restricted to official gene symbol lists. Shown are the seven genes that were selected for analysis of mRNA nuclear/cytoplasmic ratio; in bold the three genes illustrated in the figure. (B) Rhythmic ratio of nuclear versus cytoplasmic mRNA levels of three selected genes. Experimental values (n=2) can be adequately fitted (R2>0.55) with a non-linear cosinor equation in which the period value is set to 24 hr (see also Figure 6—source data 1). (CD) Loss of rhythmic ratio of nuclear versus cytoplasmic mRNA levels of 3 selected genes after Neat1 siRNA (C) or Neat1 ASO (D). Experimental values (n=2) cannot be adequately fitted (R2<0.55) with a non-linear cosinor equation in which the period value is set to 24 hr.

DOI: http://dx.doi.org/10.7554/eLife.14837.017

Figure 6—source data 1. List of Neat1 RNA target genes.
elife-14837-fig6-data1.xlsx (102.5KB, xlsx)
DOI: 10.7554/eLife.14837.018
Figure 6—source data 2. Cosinor analysis of the relative ratio nuclear/cytoplasmic mRNA of seven Neat1 RNA targets in GH4C1 cells.
DOI: 10.7554/eLife.14837.019

Figure 6.

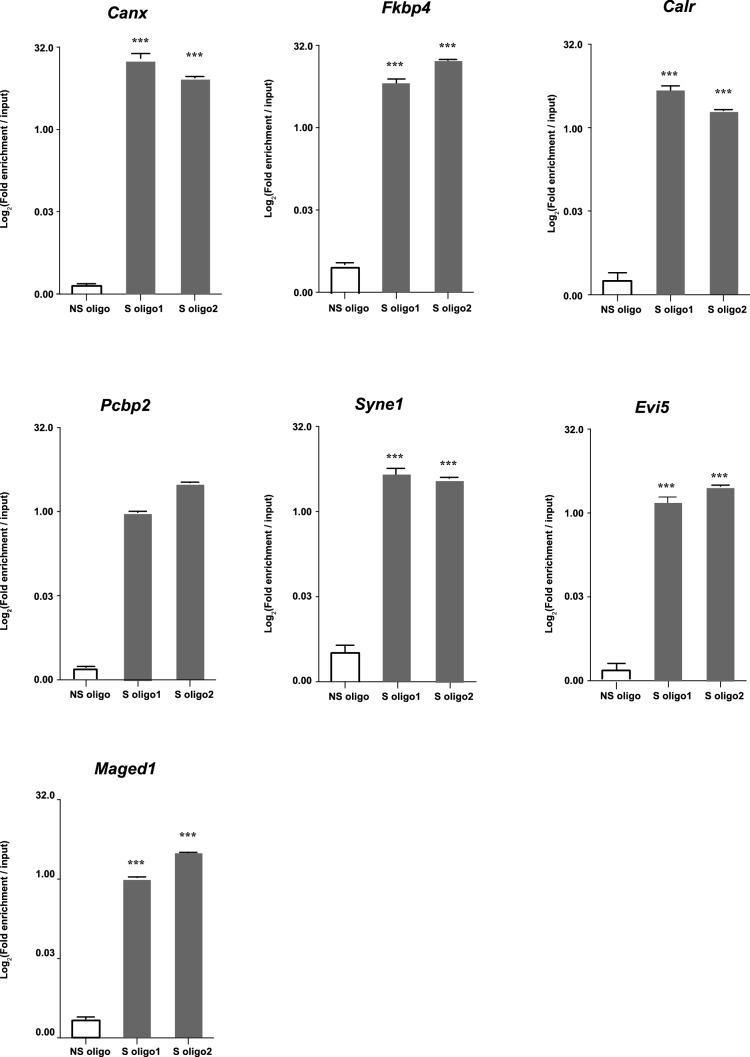
Figure 6—figure supplement 1. Enrichment relative to input in seven selected mRNA after Neat1 RNA pull-down.

Figure 6—figure supplement 1.

Enrichment relative to input obtained after using the two anti-sens specific (S oligo 1 and S oligo 2) or a non-specific (NS) oligonucleotide probes. ***p<0.001vs non-specific oligonucleotide probe.
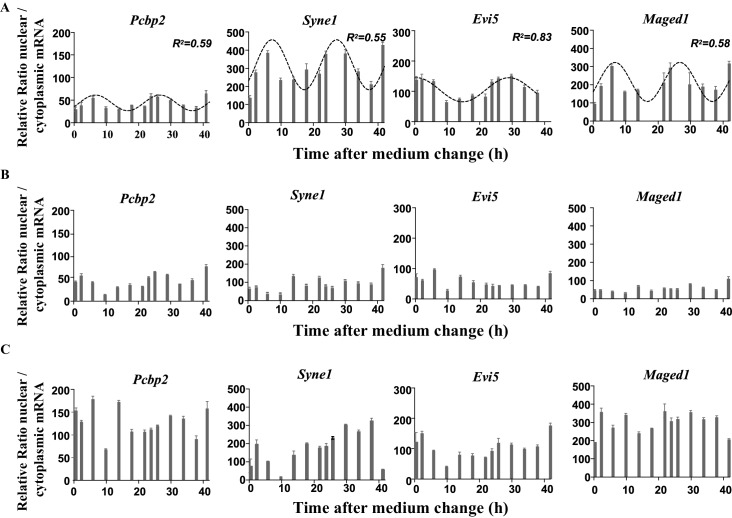
Figure 6—figure supplement 2. Rhythmic ratio of nuclear versus cytoplasmic mRNA levels of four NEAT1 RNA target genes.

Figure 6—figure supplement 2.

(A) Experimental values (n=2) of the ratio nuclear versus cytoplasmic mRNA levels can be adequately fitted (R2>0.55) with a non-linear cosinor equation in which the period value is set to 24 hr (see also Figure 6—source data 1). (B-C) Loss of rhythmic mRNA nuclear/cytoplasmic ratio after Neat1 siRNA (B) or Neat1 ASO (C). Experimental values (n=2) cannot be adequately fitted (R2<0.55) with a non-linear cosinor equation in which the period value is set to 24 hr.