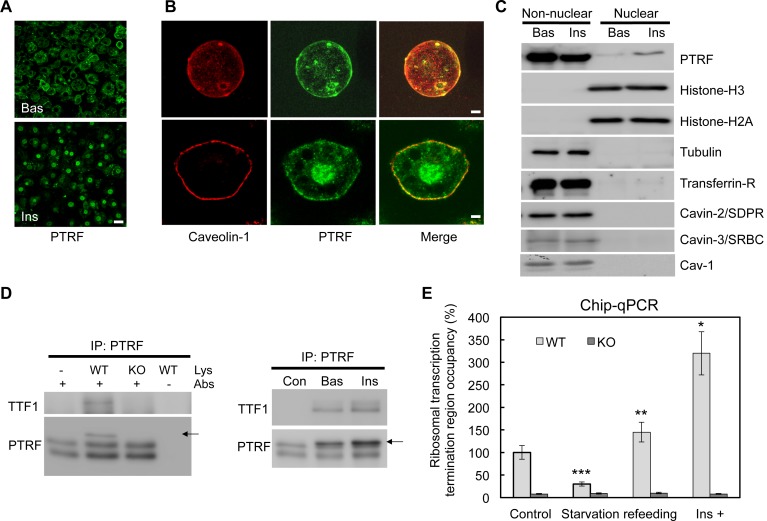
Figure 1. A functional role of PTRF in nucleus.
(A) Immunofluorescence staining of PTRF in basal and insulin stimulated 3T3-L1 adipocytes. Scale bars, 50 μm. (B) Higher magnificent images of insulin stimulated single isolated primary (top) and 3T3-L1 adipocyte (bottom) are shown, green: PTRF, and red: caveolin-1. Scale bars, 10 μm. (C) Nuclear and non-nuclear fractions from basal or stimulated primary adipocytes were subject to western blots by indicated antibodies. (D) Co-immunoprecipitation by PTRF antibody from basal and stimulated adipocytes nuclear lysate followed by western blots using TTF1 (Transcription Termination Factor, RNA Polymerase I) and PTRF antibodies, PTRF null adipocytes (KO) serving as a negative control for the co-IP. (E) Chip-qPCR assay using PTRF antibody from wild type control (WT) and PTRF null adipocytes (KO). *p<0.05, **p<0.01, and ***p<0.001; Student’s test. Error bars indicate SD.

