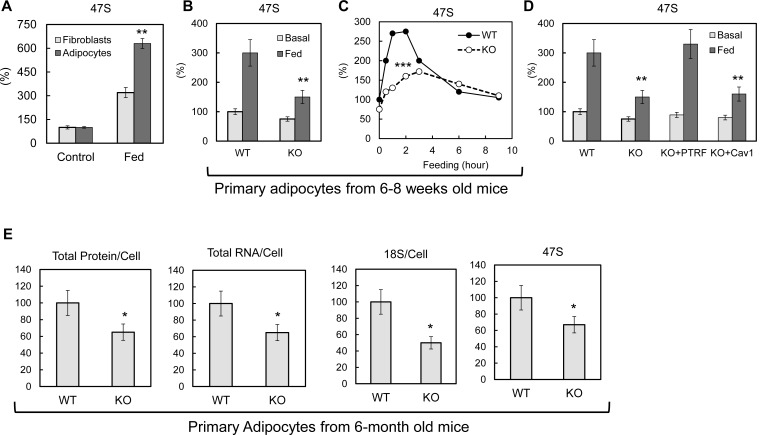
Figure 2. PTRF mediated ribosomal transcription regulations.
(A) Relative pre-rRNA (47S) levels were detected by RT-qPCR from 3T3-L1 fibroblast and fully differentiated adipocytes stimulated by switching culture medium from 1% BSA in PBS to full growth medium with insulin (Fed). (B) Basal (KRP buffer with 1% BSA) or 45 min stimulated (Fed: high glucose DMEM, 10% FBS, and insulin) pre-rRNA levels were detected by RT-qPCR in primary adipocytes isolated from wild type (WT) and PTRF null (KO) mice. (C) A stimulation time-course of B. (D) Pre-rRNA levels were detected by RT-qPCR from basal or stimulated wild type (WT), PTRF null (KO), PTRF re-transfected PTRF null (KO+PTRF), and Cav-1 re-transfected PTRF null (KO+Cav1) MEFs cells. (E) Relative levels of total proteins, RNA, 18S, and 47S from wild type or PTRF null mice (n = 6) were measured and normalized to cell numbers. *p<0.05, **p<0.01, and ***p<0.001; Student’s test. Error bars indicate SD.
Figure 2—figure supplement 1. Characterization of ribosome biogenesis in 6–8 weeks old PTRF null and control mice.
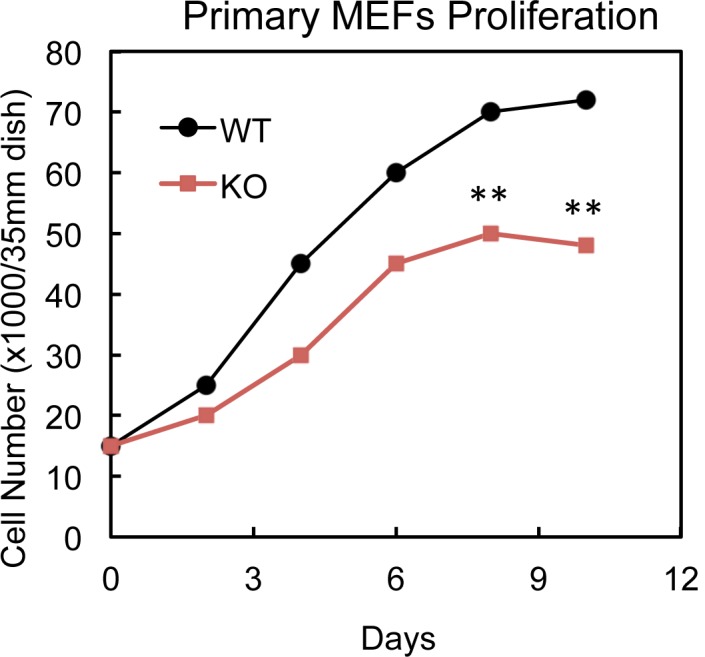
Figure 2—figure supplement 2. Cell growth curve of cultured WT and PTRF null MEFs cells.


