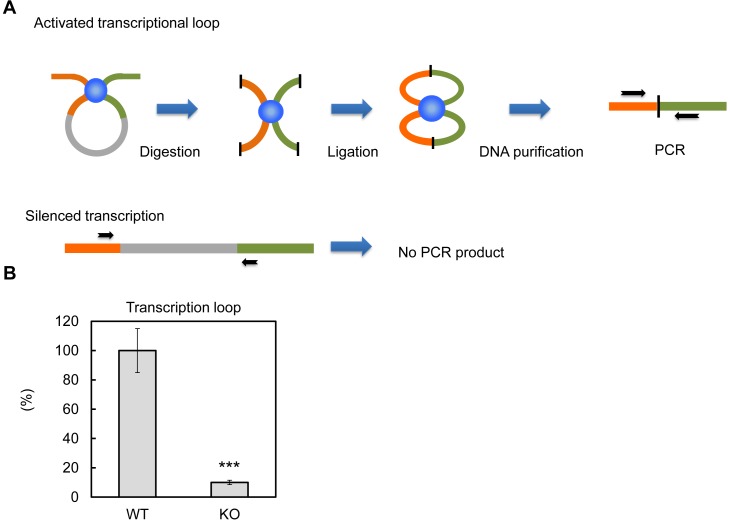
Figure 8. PTRF dependent active ribosomal transcription complex formation.
(A) Schematic illustration of chromatin confirmation capture (3C) assay, details are described in Method. (B) Following 3C assay, the relative levels of active transcription were quantified by RT-qPCR using nutrition/insulin stimulated primary mouse adipocytes from wild type (WT) and PTRF null (KO) mice (n = 4). ***p<0.001; Student’s test. Error bars indicate SD.

