Figure 3.

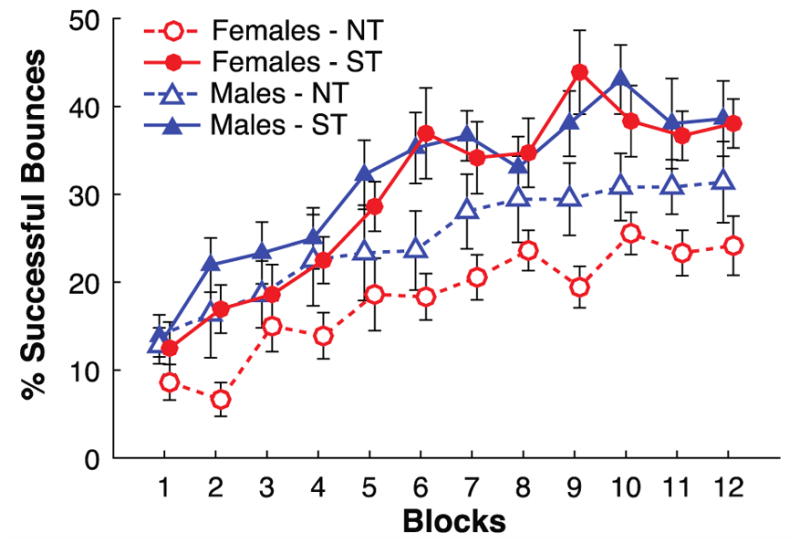
Task success in ST experiment. Each point represents the group average of task success per block, and the error bar represents the standard error across participants in each group.

Task success in ST experiment. Each point represents the group average of task success per block, and the error bar represents the standard error across participants in each group.