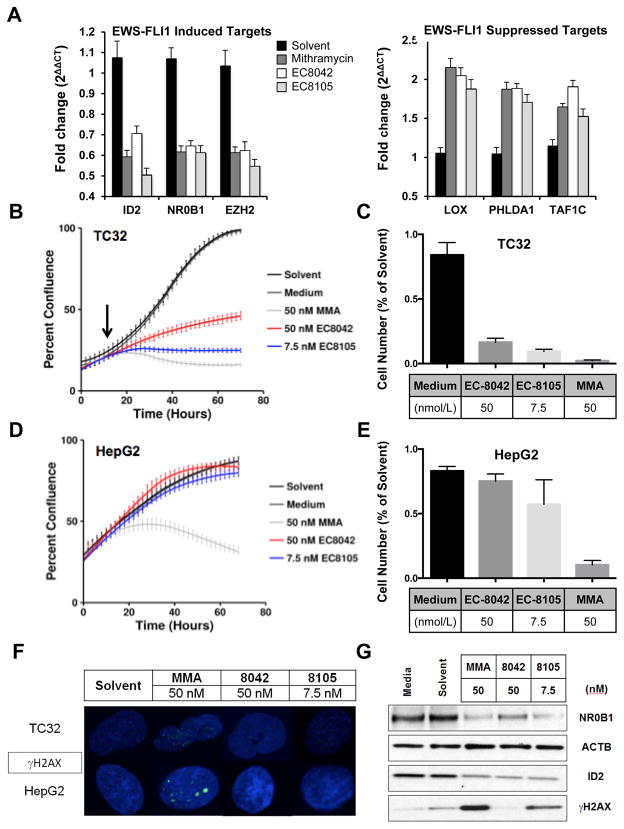
Figure 4. EC-8105 and EC-8042 are less toxic to immortalized hepatocytes at concentrations that suppress EWS-FLI1 in Ewing sarcoma cells.
A, Mean fold change in expression of EWS-FLI1-induced targets or -repressed targets as a function of GAPDH (2ΔΔCT) after treatment with 50 nmol/L mithramycin, 50 nmol/L EC-8042 or 7.5 nmol/L EC-8105 for 12 h. qPCR data is the average of 3 independent experiments. B, Time-lapse microscopy demonstrating suppression of TC32 Ewing sarcoma cell proliferation over time following drug addition and EWS-FLI1 target suppression (black arrow) for 50 nmol/L mithramycin, 50 nmol/L EC-8042 or 7.5 nmol/L EC-8105 C, End point MTS assay confirming effect on cell viability in TC32 cells. D, Time-lapse microscopy demonstrating suppression of HepG2 proliferation with 50 nmol/L mithramycin but not 50 nmol/L EC-8042 or 7.5 nmol/L EC-8105. E, End point MTS assay confirming effect on cell viability in HepG2 cells. F, Confocal microscopy and G, western blot analysis demonstrates induction of DNA damage as measured by the phosphorylation of γH2AX at concentrations that suppress expression of the EWS-FLI1 target gene NR0B1 only with 50 nmol/L mithramycin and not with 50 nmol/L EC-8042 or marginally with 7.5 nmol/L EC-8105.

