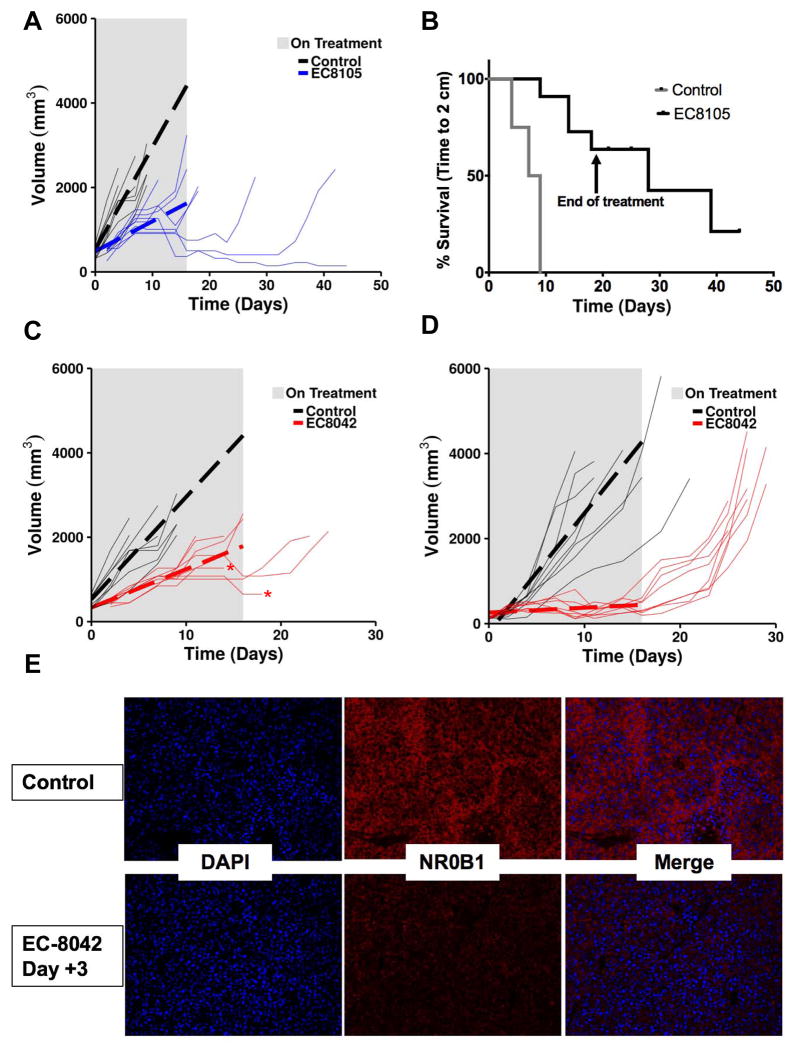
Figure 5. EC-8105 and EC-8042 suppress Ewing sarcoma xenograft growth.
A, Prediction plot showing mean tumor volume (dotted line) while on treatment (grey rectangle) and tumor growth for individual mice (thin lines) bearing a TC71 xenograft treated with 1.5 mg/kg of EC-8105 IV on a Q3D X 8 schedule. B, Survival curves for mice bearing the TC71 xenografts showing time to 2 cm in control (grey) and mice treated with 1.5 mg/kg of EC-8105 IV on a Q3D X 8 schedule (black). C, Prediction plots showing mean tumor volume (dotted line) while on treatment (grey rectangle) and tumor growth for individual mice (thin lines) bearing a TC71 xenograft treated with 24 mg/kg of EC-8042 IV Q3D X 8 or D, 24 mg/kg IP on a M, W, F X 8 schedule. Arrows indicate final day of treatment. E. Representative tissue section showing suppression of NR0B1 expression by immunofluorescence following treatment with IP EC-8042.

