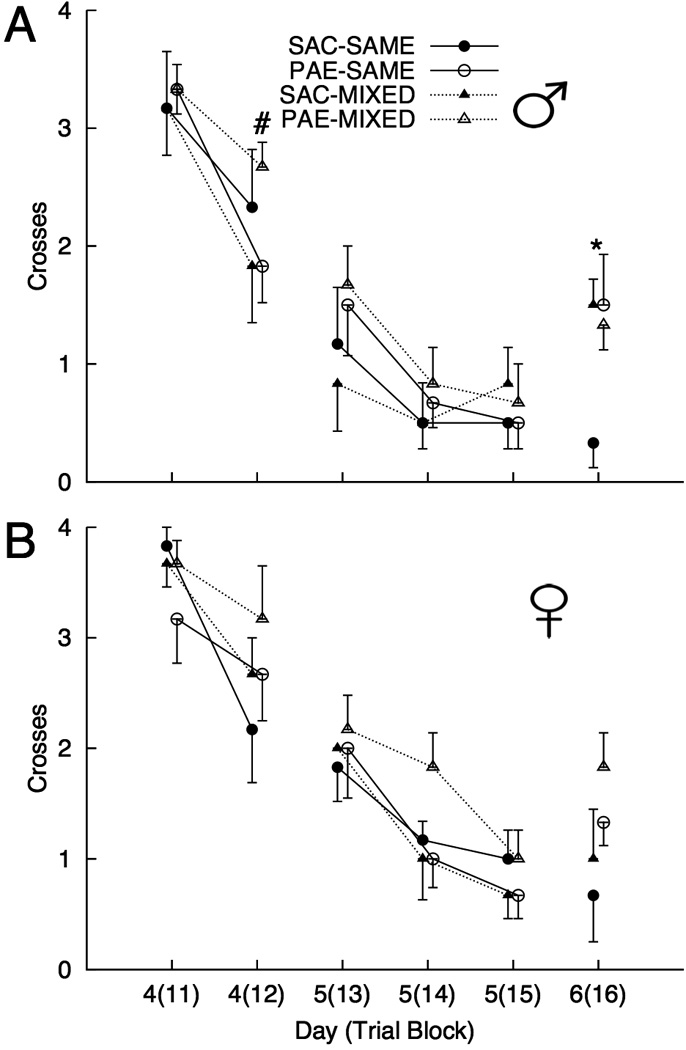
Figure 2.

Mean (±SEM) number of visits (crosses) to the Phase 1 platform location during the 6 trial blocks of Phase 2 (blocks 11–16, conducted across days 4, 5, and 6) for males (A) and females (B) for each combination of prenatal treatment [saccharin (SAC) and prenatal alcohol-exposed (PAE)] and housing [Same and Mixed]. (n = 6 per group). [* indicates a significant effect of housing within SAC males and a significant prenatal treatment effect within males in the SAME housing condition, as well as a significant prenatal treatment effect collapsing across sex and housing at p < 0.05. # indicates a housing effect in PAE males at p < 0.05].
