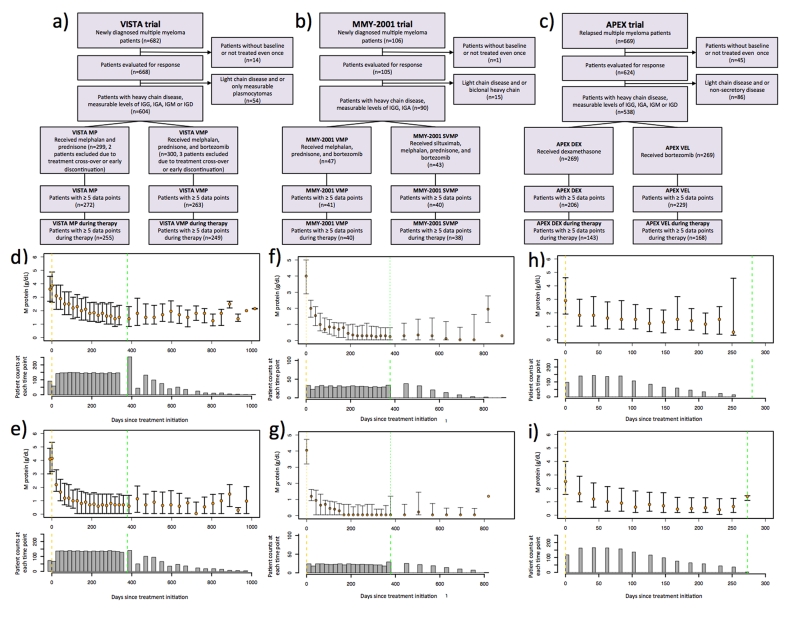
Figure 1. Patient selection criteria and M-protein treatment response in the VISTA and APEX trials.
(a-c) Flowcharts outlining the patient inclusion and exclusion criteria for quantitative analysis of M-protein treatment response. (d-i) Median longitudinal M-protein trajectories for each cohort in the three trials, and the associated numbers of patients at each time point: d): VISTA MP cohort, e): VISTA VMP cohort, f): MMY2001 VMP cohort, g): MMY2001 SVMP cohort, h): APEX DEX cohort and i): APEX VEL cohort. The median M-protein values are indicated by the orange circles, and quartiles are indicated by the whiskers. The numbers of patients at each time point are shown by the histograms. Vertical yellow and green dashed lines indicate treatment initiation and termination times, respectively. For the VISTA and MMY-2001 trials (panels d-g), only patients who completed the entire treatment regimen are included. For the APEX trial (panel h-i), due to the small number of patients who completed the entire treatment regimen, only the M-protein response during treatment is shown.

