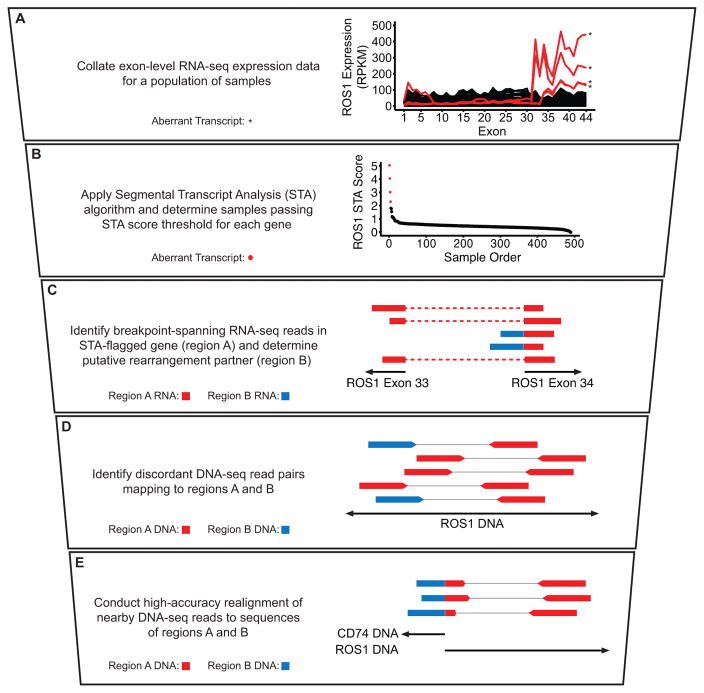
Figure 1. Quantitative prediction by STA facilitates an integrated fusion detection pipeline.
A–E, Stepwise description of STA discovery pipeline with accompanying schematics and example data. A, Exon-level expression values for a population of samples plotted as continuous lines. Samples passing STA score threshold (B) are plotted in red and denoted by asterisks; samples below the threshold are plotted in black. B, ROS1 STA scores for each sample plotted in descending order. Samples with an STA score of 2 or above are plotted in red; samples with an STA score below 2 are plotted in black. C, Schematic of RNA-seq reads. Dotted lines denote continuous read segments. D, Schematic of discordant whole-genome sequencing (WGS) read pairs. Thin lines represent denote read pairs. E, Schematic of breakpoint-spanning WGS reads identified after realignment. In C–E, colors indicate alignment location of individual read segments, as depicted in the description at left. Schematics are not to scale.

