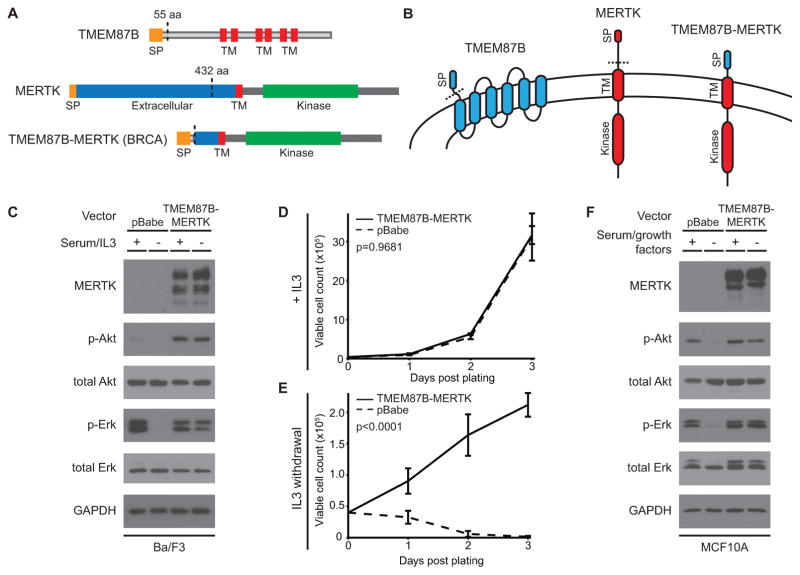
Figure 2. The TMEM87B-MERTK gene fusion in TNBC promotes constitutive oncogenic signaling and cell survival.
A, Diagram of the TMEM87B and MERTK proteins and the DNA-validated gene fusion protein product. Protein features are labeled. B, Protein schematics indicating membrane topology (not to scale). Colors indicate protein sequences as indicated. In A and B, dotted lines represent protein regions encoded by the gene fusion transcript. C, Immunoblot analysis of the indicated proteins from Ba/F3 cells transfected with an empty vector or one expressing the TMEM87B-MERTK fusion gene. Cell lines were grown in the continuous presence of 5% FBS and 1 ng/mL IL3 (+) or switched to 0.5% FBS and no IL3 (−) for 90 min. D–E, Graphs depicting growth curves of Ba/F3 cells transfected with the TMEM87B-MERTK fusion gene (solid line) or empty vector (dotted line). Cells were grown in the continuous presence of 1 ng/mL IL3 (D) or switched to no-IL3 media at day 0 (E) and viable cell counts were obtained by hemocytometer with trypan blue exclusion at the indicated timepoints. Error bars represent standard deviation of three replicates and p-values comparing the two conditions are specified at top left. F, Immunoblot analysis of the indicated proteins from MCF10A cells transfected with constructs identical to C. Cells were grown in complete growth media with 2.5% horse serum (+) or switched to base media with 0.5% horse serum and no growth factor additives for 180 min (−). aa: amino acid; BRCA: breast invasive carcinoma; SP: signal peptide; TM: transmembrane.

