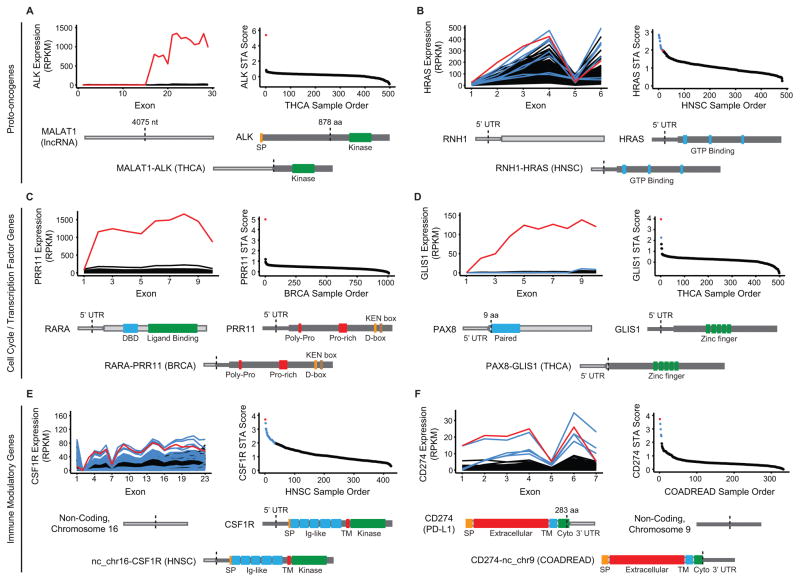
Figure 5. Overexpression of oncogenic transcripts across cancer types results from gene rearrangement with coding and non-coding DNA.
A–F, Six examples of STA-predicted rearrangements from additional tumor types in TCGA, representing the categories described at left. Each panel features an exon-level expression diagram and STA score plot for the gene and cancer type analyzed. Red indicates the representative DNA-validated rearrangement that is depicted at the bottom of each panel as a schematic of the resulting aberrant protein. Blue indicates additional aberrant transcripts meeting STA score threshold. Black indicates background population below threshold. Protein features and untranslated regions (UTRs) are labeled and dotted lines indicate hybrid transcript junctions. aa: amino acid; BRCA: breast invasive carcinoma; COADREAD: colorectal carcinoma; Cyto: cytoplasmic domain; HNSC: head and neck squamous cell carcinoma; nt: nucleotide; SP: signal peptide; THCA: thyroid carcinoma; TM: transmembrane.

