
Figure 3.
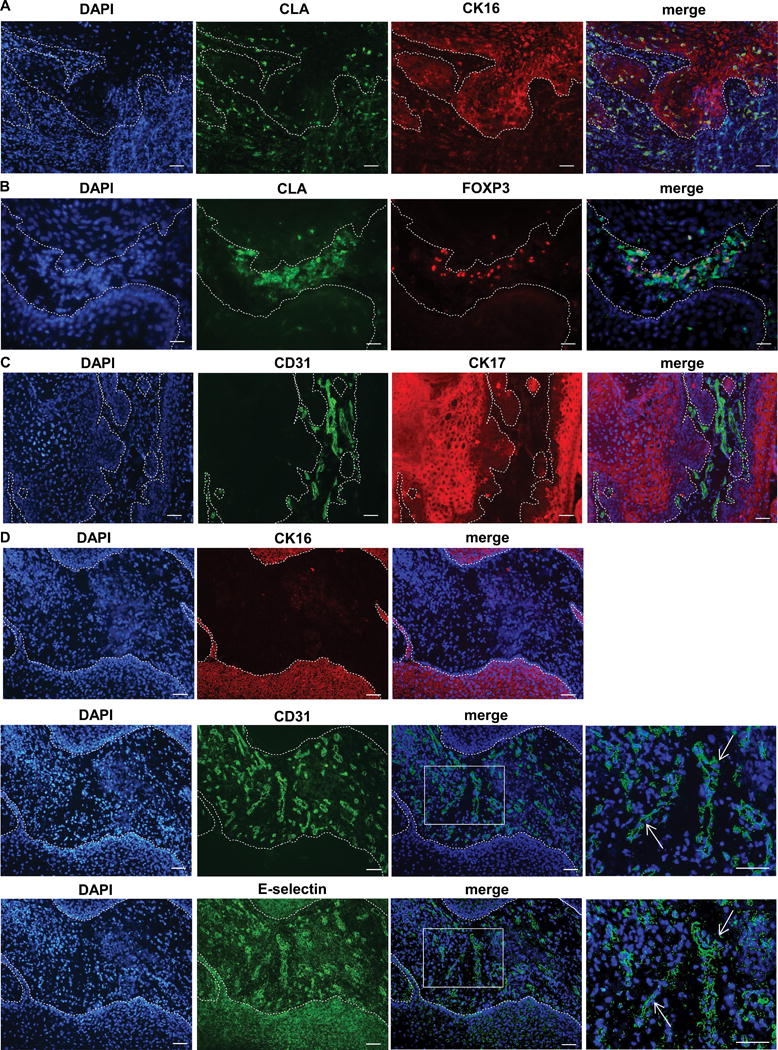
cSCC Tregs express the skin homing marker CLA. (A) Immunofluorescence microscopy of cSCC cryosections showing CLA+ tumoral immunocytes, cytokeratin (CK) 16 highlights tumor keratinocytes. (B) Immunofluorescence microscopy demonstrating CLA+ FOXP3+ Tregs in cSCC. (C) CD31+ staining highlighting peritumoral blood vessels in cSCC stroma, cytokeratin (CK) 17 positivity indicates tumor keratinocytes. (D) Sequential cSCC sections showing e-selectin expression in the peritumoral vasculature (highlighted by CD31 straining) between cytokeratin (CK) 16 positive tumor islands. Arrows in the right hand boxes, which depict higher power images of the merged images, indicate the same blood vessels in sequential sections. Dashed lines represent the outlines of the tumor in A – D, scale bars = 50 μm.