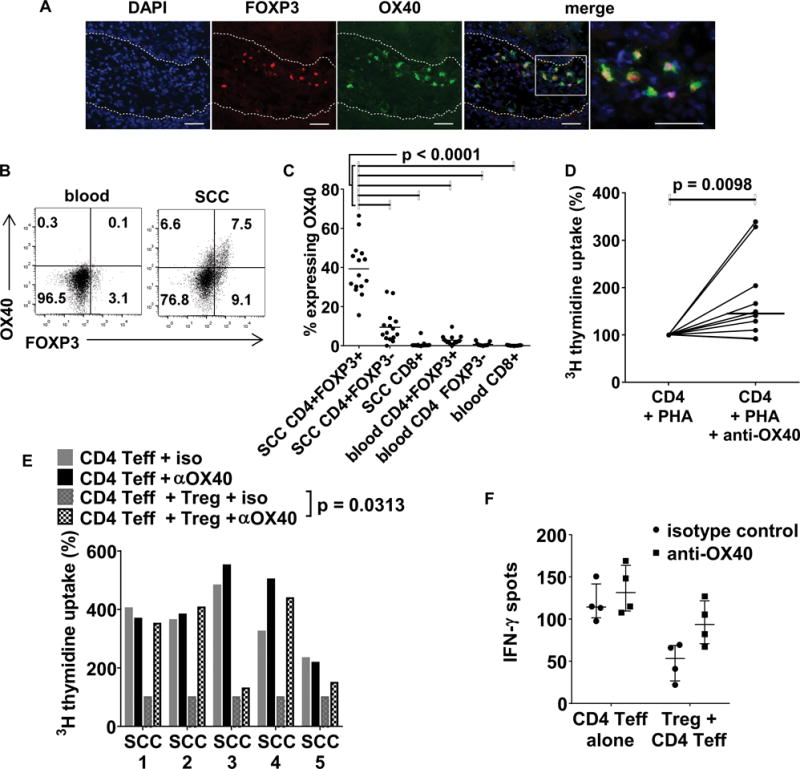
Figure 5.

OX40 is expressed by Tregs in cSCC and in vitro OX40 activation enhances tumoral CD4+ T cell proliferation. (A) Immunofluorescence microscopy showing OX40 on tumoral FOXP3+ Tregs. Dashed lines indicate the outline of the cSCC tumor islands, scale bars = 50 μm. (B) Flow cytometry plots of CD3+CD4+ gated lymphocytes from cSCC and corresponding peripheral blood showing OX40 and FOXP3 expression. (C) FACS quantification of OX40 expression in tumoral Tregs, tumoral effector T cells and peripheral blood Tregs, n=15 tumors, horizontal bars=means. (D) Tumoral CD4+ T cells isolated by flow cytometry from 10 fresh cSCCs were cultured with 1μg/ml PHA + autologous irradiated CD3+ cell depleted irradiated PBMCs ± agonistic anti-OX40 antibody (5μg/ml). Proliferation was assessed by tritiated thymidine uptake, dots = median values from triplicate wells for each tumor, horizontal bar = median value from all tumors. (E) Tritiated thymidine uptake assays were performed where tumoral CD4+ effector T cells were cultured ± tumoral Tregs ± agonistic anti-OX40 antibody. Median values from triplicate wells are shown and represented as normalized to 100% of CD4 Teff + Treg + iso, n=5 tumors. (F) interferon-γ ELISPOT assays, showing that the effect of the agonistic OX40 antibody is more apparent when tumoral Tregs are present in culture. Dots/circles = median values for each tumor with circles for isotype control, squares for anti-OX40, horizontal bar = median for all tumors, error bars = IQR, n=4 tumors.
