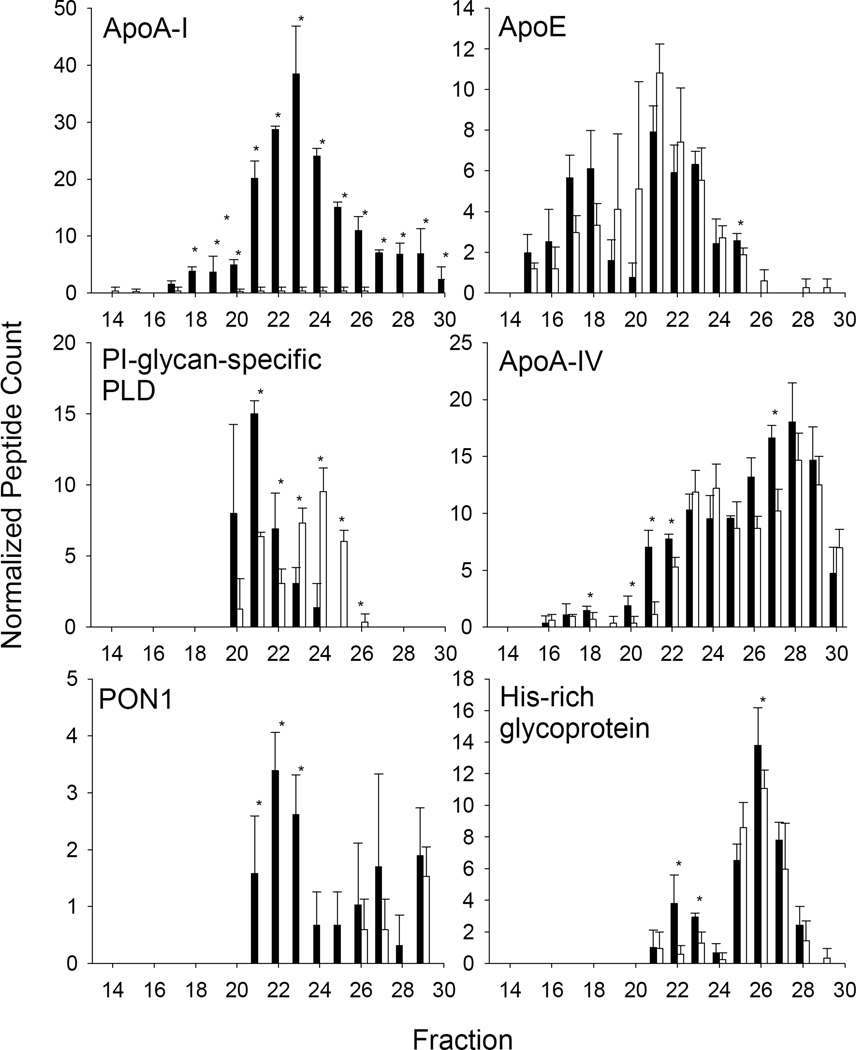
Figure 5.
Examples of proteins undergoing a size shift in response to apoA-I ablation. The normalized peptide counts (determined as in Fig. 5) for a given protein across each fraction are shown. For all figures, WT mouse data is represented by filled bars, apoA-I KO data is represented by open bars. Data represents a mean peptide count from 3 animals in each group. Stars indicate a significant difference between the groups by t-test p<0.05.

