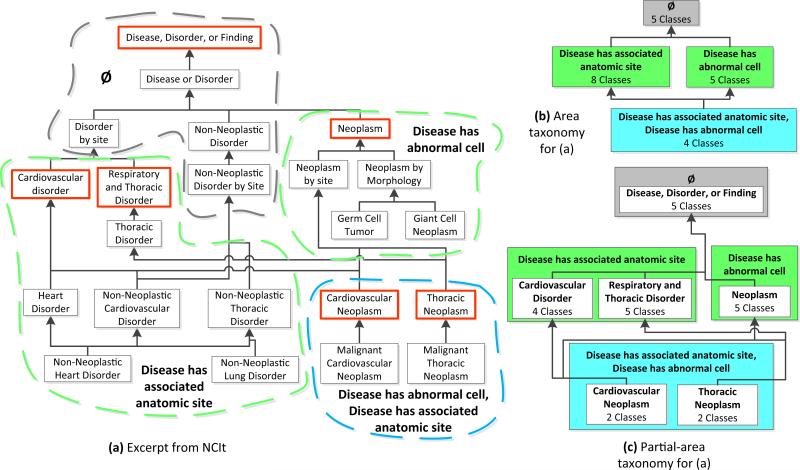
Fig. 3.
(a) An excerpt of 22 classes from the NCIt Disease, Disorder or Finding hierarchy. Classes are shown as boxes labeled with concept names. Upward directed arrows are the subsumption relationships between concepts. Bold text in colored, dashed bubbles indicates which properties are used in the restrictions for a given set of concepts. Each root class is identified by a red outline. (b) The area taxonomy for the classes in (a), derived according to the properties in restrictions. The 22 classes are summarized by four area nodes. Areas are organized into three color-coded levels according to their numbers of property types. The top level (gray) area node represents classes with no properties. Sets of properties are used as area names. Arrows between areas are child-of links (e.g., the area {Disease has abnormal cell, Disease has associated anatomic site} is a child-of the area {Disease has associated anatomic site} and also of the area {Disease has abnormal cell}). (c) The partial-area taxonomy for the classes in (a). Each white box represents a partial-area. Partial-area nodes are labeled with their root class’ name and the total numbers of classes summarized by them. Upward directed arrows represent child-of links between partial-area nodes (e.g., the Neoplasm partial-area node is child-of the Disease, Disorder, or Finding partial-area node). The partial-area taxonomy appears as an overlay of the area taxonomy in (b). Partial-areas may overlap (i.e., two partial-areas may summarize the same class). The classes Heart Disorder and Non-neoplastic Heart Disorder are summarized by both the Cardiovascular Disorder and Respiratory and Thoracic Disorder partial-area nodes. (For interpretation of the references to color in this figure legend, the reader is referred to the web version of this article.)

