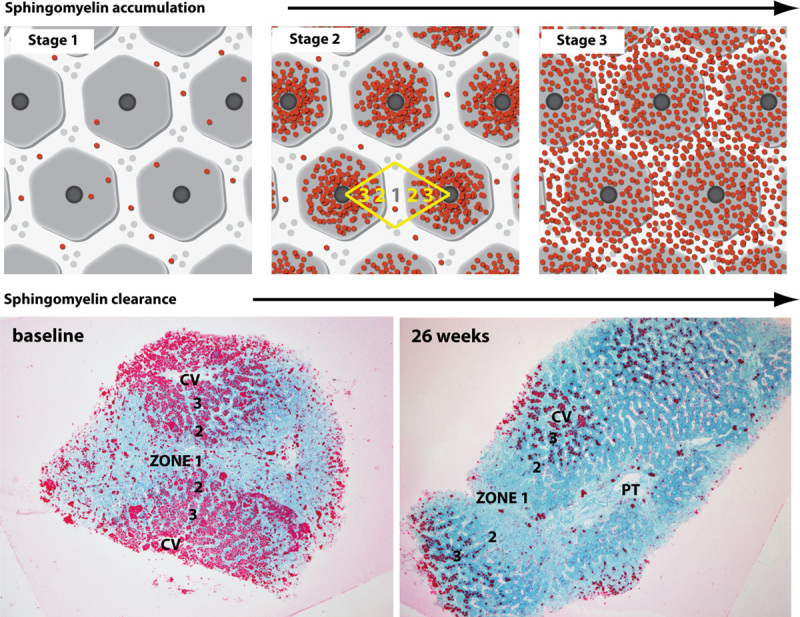
FIGURE 3.

Patterns of hepatic SM accumulation and clearance. The top 3 panels illustrate in cartoon format the 3 primary stages of SM accumulation observed in the patient biopsies. Acinar zones are marked in yellow. The bottom 2 panels show the pattern of SM clearance in a patient biopsy with moderate SM levels (stage 2) at baseline. Pretreatment and posttreatment biopsy images are shown for patient 5. At baseline, substrate accumulation was heaviest around central veins (CV), particularly acinar zones 3 and 2. After 26 weeks of olipudase alfa, there was noticeable clearance of SM in zones 1 and 2, with reduction in zone 3 (Epon semithin sections, lysenin affinity stain). PT indicates portal triad, 20x.
