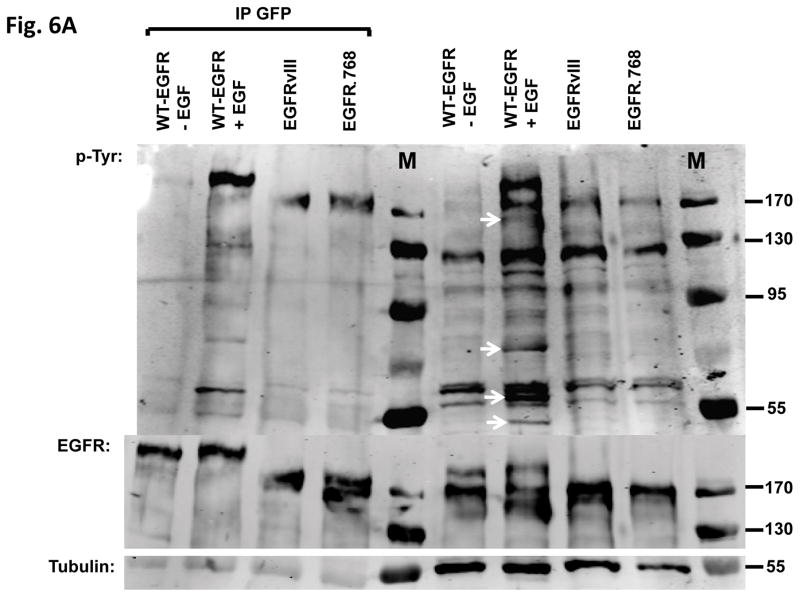
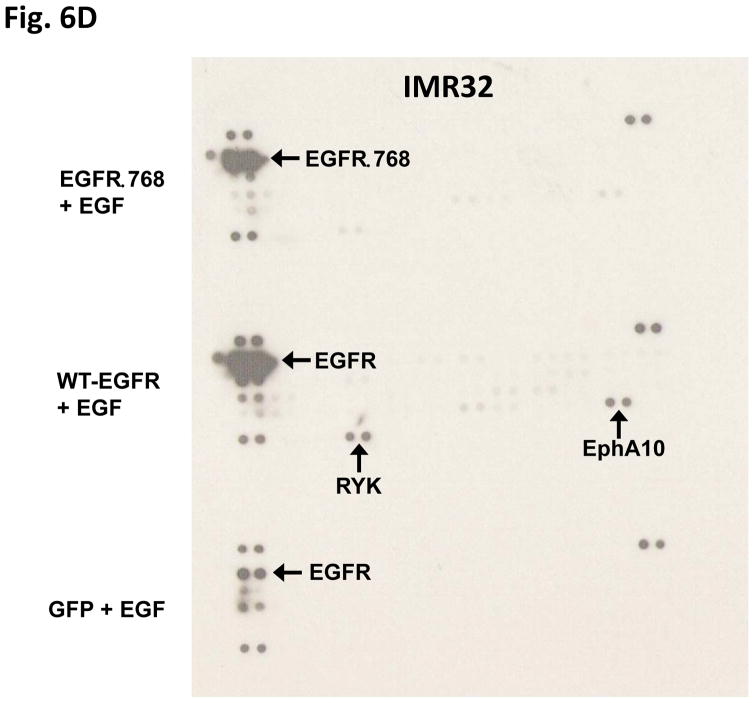
Fig. 6. Comparison of signaling pathways downstream of EGFRΔ768 and WT-EGFR.
(A) Tyrosine phosphorylation pattern of activated WT-EGFR, EGFRΔ768 and EGFRvIII in the transiently transfected IMR32 cells. White arrows pointed to tyrosine phosphorylated protein bands that were present in the WT-EGFR cell lysate, but not in the EGFRΔ768/vIII lysates. (B) Phosphokinase array analysis of activated WT-EGFR and EGFRΔ768 in the BE2C cells. p53 signaling pathway was activated at baseline in these cells because of a known p53 mutation (48). WT-EGFR activation resulted in phosphorylation of Erk1/2 in these cells. (C) Phosphokinase array analysis of activated WT-EGFR and EGFRΔ768 in the transiently transfected IMR32 cells. WT-EGFR activation resulted in phosphorylation of WNK1 in these cells. Noted that IMR32 cell has baseline HSP60 signal. (D) Phosphoreceptor tyrosine kinase array analysis of activated WT-EGFR and EGFRΔ768 in the transiently transfected IMR32 cells. WT-EGFR activation resulted in phosphorylation of EphA10 and RYK in these cells. Noted the strong EGFRΔ768 phosphorylation signal detected by the array.


