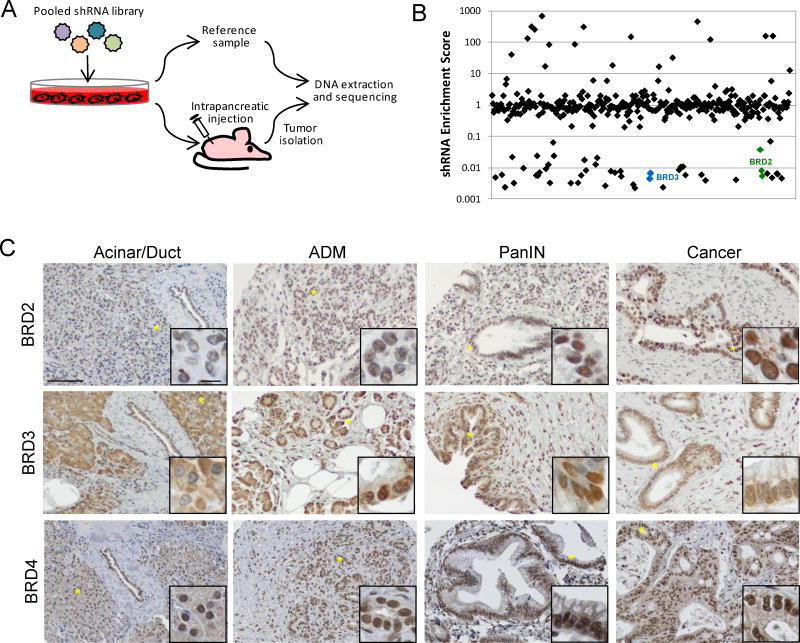
Figure 1.
BET proteins are identified in an in vivo shRNA screen for epigenetic regulators in PDAC. A. Schematic representation of the pooled shRNA screen. B. Representative shRNA distribution from a tumor derived from cells infected with pooled shRNA library. Individual shRNAs are plotted on the x-axis and their relative enrichment/depletion in the tumor is plotted in log scale on the y-axis. Depleted shRNAs targeting BRD2 (green) and BRD3 (blue) are indicated. C. Representative images of normal, premalignant, and malignant pancreatic tissue stained with antibodies specific for BRD2, BRD3, and BRD4. Scale bars = 100 μm in main images and 10 μm in insets. Locations of the inset images within the main images are indicated by asterisks.

