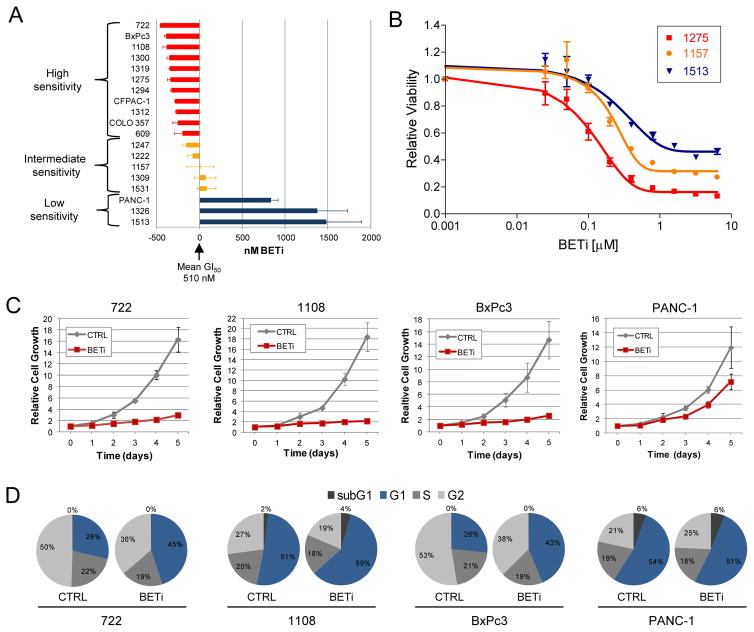
Figure 2.
BET bromodomains contribute to PDAC cell growth in vitro and in vivo. A. PDAC cell lines were exposed to increasing amounts (0–6.4 μM) of BETi and analyzed for changes in growth after six days. The deviation from the mean GI50 of each cell line is shown. B. Representative dose response curves for cell lines exhibiting high (red), intermediate (orange), and low (blue) sensitivity to BETi are shown. C. Growth curves of PDAC cell lines treated with 1.6 μM BETi or CPI440 (CTRL). The averages (±SEM) from at least two experiments performed in duplicate are shown. D. Distribution of PDAC cells in the cell cycle was determined by propidium iodide staining after treatment with 1.6 μM BETi or CPI440 (CTRL) for three days. Results are representative of three experiments.

