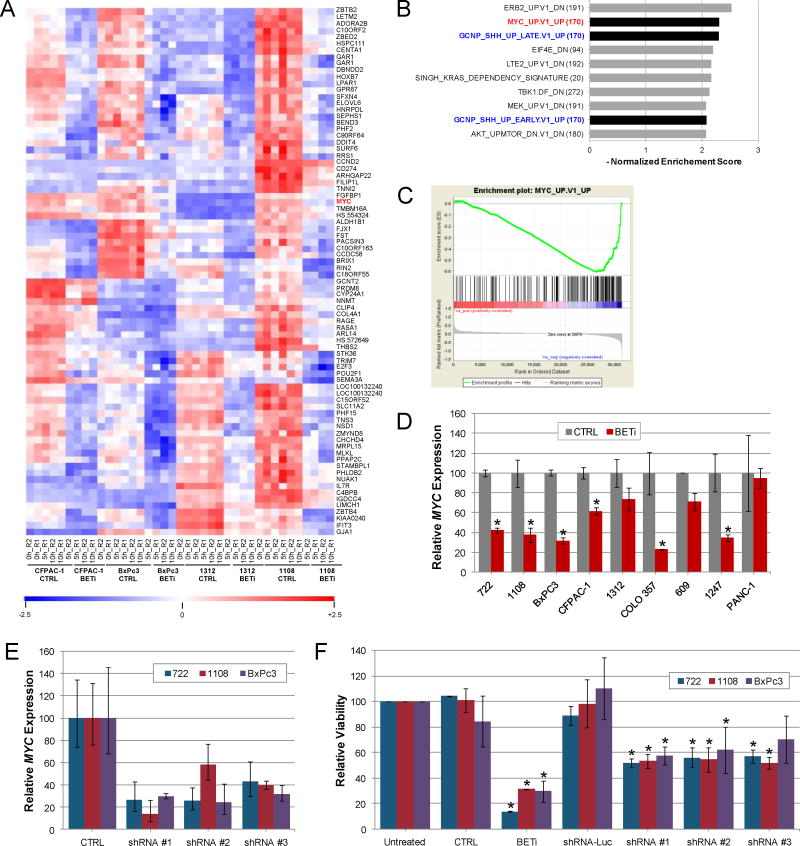
Figure 3.
Regulation of MYC by BET family members contributes to growth of PDAC cells. A. Genome wide transcription analysis of PDAC cell lines. A heat map of the top 80 down-regulated genes in CFPAC-1, BxPc3, 1312, and 1108 cells after BET bromodomain inhibition is shown. High (red) and low (blue) gene expression are indicated. B. Top 10 programs identified by GSEA analysis (C6) of BET-regulated genes. C. GSEA enrichment plots comparing BETi responsive genes to those regulated by MYC. D. qPCR analysis of MYC expression in PDAC cell lines treated with BETi for 10 hours. Average (± std. dev.) is shown. Asterisk indicates changes in gene expression with p<0.05. E. Expression of MYC in PDAC cells after infection of viruses expressing control shRNA (CTRL) targeting luciferase or shRNAs targeting MYC. qPCR analysis of MYC was normalized to uninfected cells and the average and standard deviation is shown. F. PDAC cell lines infected with shRNAs were analyzed for changes in cell viability six days after infection. Parallel cultures of uninfected cells were treated with 1.6 uM BETi or control. Cell viability was normalized to uninfected cells and the average and standard deviation is shown. Asterisk indicates changes in viability with p<0.05.

