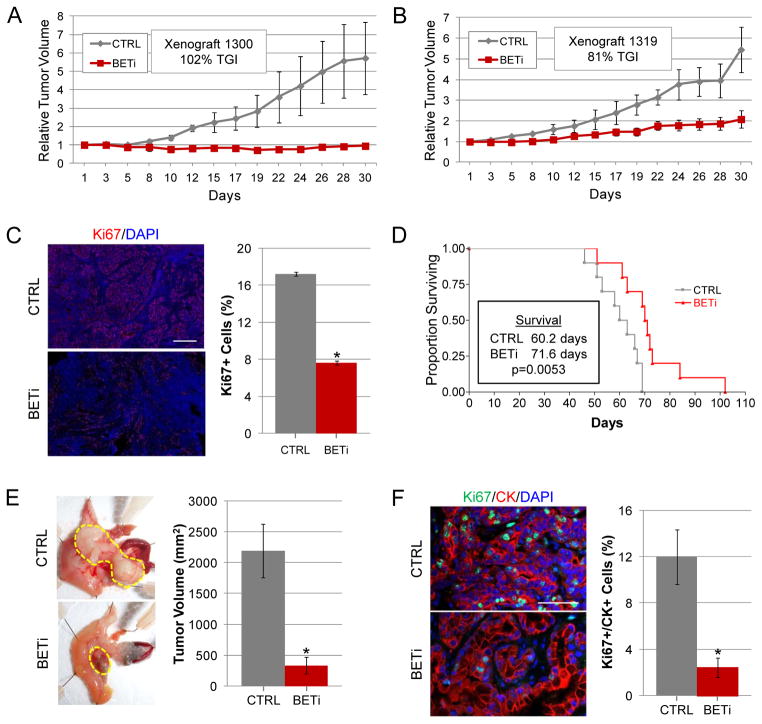
Figure 5.
BET bromodomains regulate PDAC tumor growth. A–B. Mice bearing heterotopic tumors derived from the PDAC cell line 1300 or 1319 were treated for 30 days with BETi (1300 n=3; 1319 n=5) or vehicle control (1300 n=3; 1319 n=3) upon tumors reaching 125 mm3. Average relative tumor volumes (±SEM) are plotted. Percent tumor growth inhibition (TGI) relative to control mice is indicated. C. Tumors derived from the PDAC cell line 1300 treated with BETi or vehicle control were analyzed for their proliferative index by staining for Ki67. Representative images from tumors are shown. Scale bars = 100 μm. Quantitative analysis of Ki67 stained sections are shown on the right. Asterisk indicates p<0.0001. D. A Kaplan-Meier survival plot of genetically engineered mice (Pdx-1-Cre;KRASG12D;p53−/−) treated with BETi (n=10) or vehicle control (n=10) starting at 6 weeks of age. E. Representative pictures of tumor bearing pancreata from control and BETi treated mice. The borders of the tumors are outlined in yellow. The average (±SD) tumor volumes are plotted on the right. Asterisk indicates p<0.003. F. Tumors derived from the Pdx-1-Cre;KRASG12D;p53−/− mice treated with BETi or vehicle control were analyzed the expression of Ki67 and cytokeratin by immunofluorescence. Representative images from tumors are shown. Scale bars = 100 μM. Quantitative analysis of cytokeratin and Ki67 stained sections are shown on the right. Asterisk indicates p<0.02.

