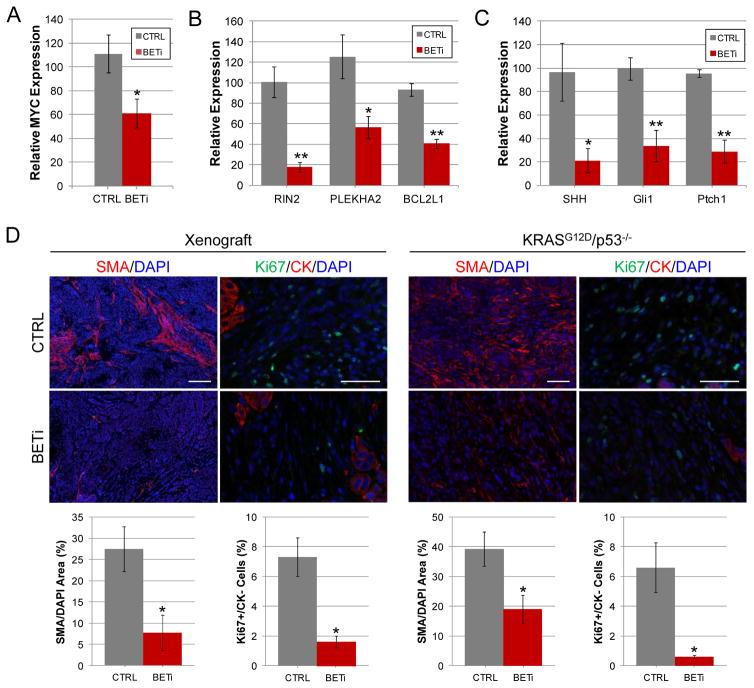
Figure 6.
BET bromodomains regulate key pathways required for PDAC cell growth and maintenance of the tumor microenvironment. A. qPCR analysis of MYC expression in neoplastic cells of orthotopic tumors formed by the implantation of human PDAC cell line 1319 is shown. Asterisk indicates significant (p<0.05) change in gene expression. B. qPCR analysis of RIN2, PLEKHA2, and BCL2L1 expression in neoplastic cells of 1319 orthotopic tumors is shown. Single and double asterisks indicate significant (p<0.03 and p<0.001, respectively) changes in gene expression. C. qPCR analysis of SHH expression in neoplastic cells of 1319 orthotopic tumors and Gli1 and Ptch1 expression in the mouse-derived stroma are shown. Single and double asterisks indicate significant (p=0.03 and p<0.008, respectively) changes in gene expression. D. Heterotopic tumors derived from the PDAC cell line 1300 and KRASG12D;p53−/− mice treated with BETi or vehicle control as described in Fig. 5 were analyzed for their tumor associated fibroblast (SMA) and proliferation Ki67 of cytokeratin negative stromal cells. Representative images from tumors are shown. Scale bars for SMA and Ki67 images = 100 μm and 50 μm respectively. Quantitative analysis of SMA and Ki67stained sections are shown below the corresponding images. Asterisk indicates p<0.04.

