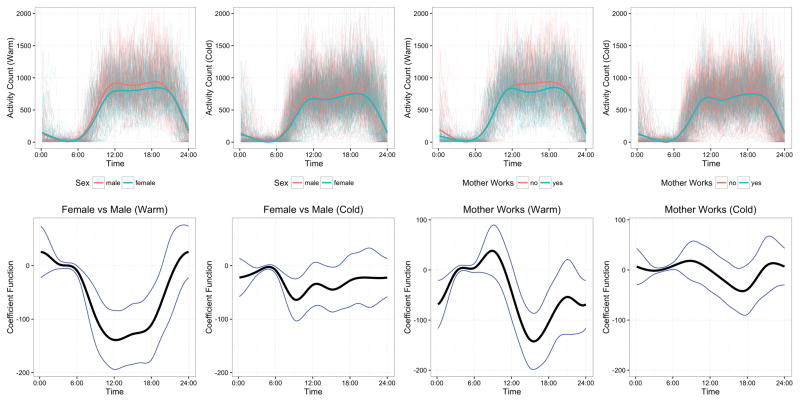
Figure 2.
Observed accelerometer data for all subjects (faded curves) and group averages (bold curves) are shown in the top panels, separately by season and colored by covariate value. The bottom row shows estimated coefficient functions in the function-on-scalar regression model (black curves), with pointwise 95% confidence intervals (blue curves), corresponding to the comparison in the top row.

