
Figure 8.
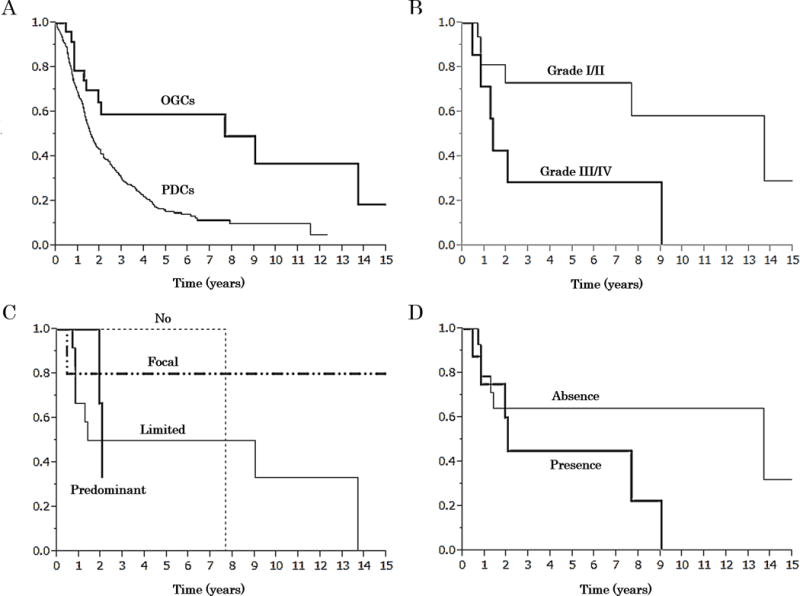
Kaplan-Meier overall survival curves. A: A comparison between of patients with undifferentiated carcinoma with osteoclastic giant cells of the pancreas (OGCs) and that of pancreatic ductal adenocarcinoma without osteoclastic giant cells (PDCs). Survival of OGCs was significantly better than that of PDCs (5-year survival rate; 59.1 vs 15.7%, median; 7.67 vs 1.59 years, respectively, Log-rank test p=0.0009). B: A comparison of grades I, II versus III, IV per modified Netherlands Committee of Bone Tumours. Survival of grade I (n=12) and II (n=14) was significantly better than that of Grade III (n=10) and IV (n=2) (5-year survival rate; 73.1 vs 28.6%, median; 13.7 vs 1.4 years, respectively, Log-rank test p=0.0288). C: Survival of cases with different amount of ductal component. [No (n=9): 0%, Limited (n=16): 0%>, ≦10%, Focal (n=9): 10%<, <50%, Predominant (n=4): ≧50%, 5-year survival rate; 100 vs 50.0 vs 80.0% (the predominant group did not reach follow up periods), median; 7.7 years vs 5.2 years vs not reach vs 2.1 years, respectively, Log-rank test p=0.5385]. D: There was no significant difference in survival between cases with versus those without osteoid (5-year survival rate; 45.0 vs 64.3%, median; 2.0 vs 13.7 years, respectively, Log-rank test p=0.2521).