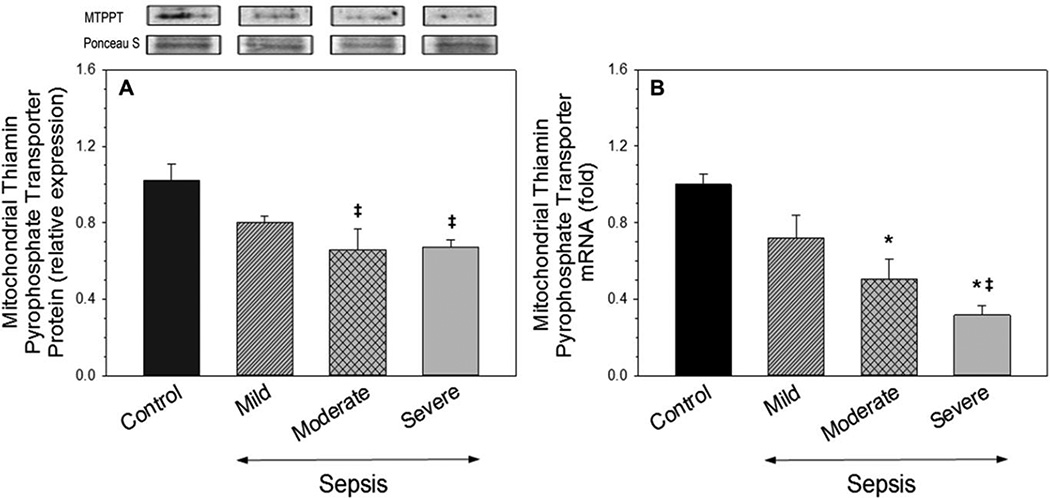
FIGURE 4.
Mitochondrial thiamin pyrophosphate transporter protein (panel A) and mRNA (panel B).
Values are mean ± SE; n = 4 for each group. Representative gel images of MTPPT proteins of different groups were obtained from the same gel.
Mitochondrial thiamin pyrophosphate transporter protein:
‡ P = 0.028 severe sepsis compared with control.
‡ P = 0.022 moderate sepsis compared with control.
Mitochondrial pyrophosphate transporter mRNA:
* P < 0.001 severe sepsis compared with control.
* P = 0.004 moderate sepsis compared with control.
‡ P = 0.021 severe compared with mild sepsis.

