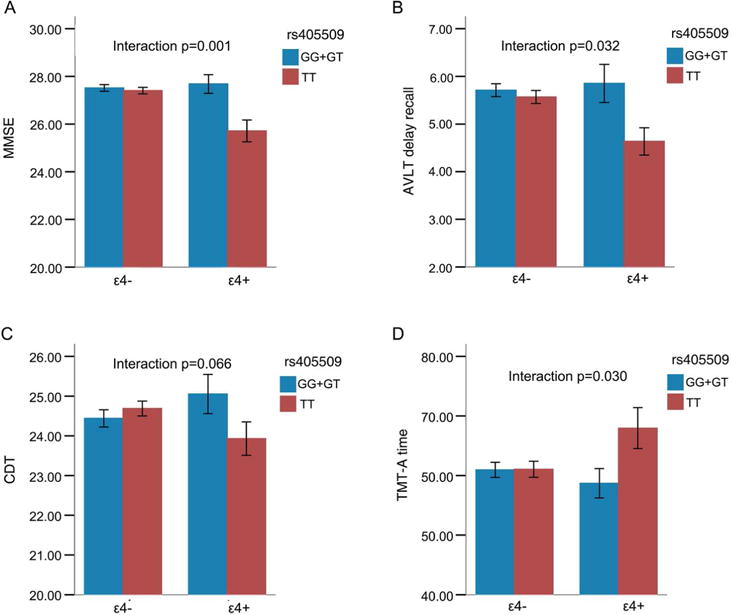
Figure 2. Diagrams of group-specific MMSE, AVLT delay recall, CDT and TMT-A time in a sample of 836 participants.

X axis: left, APOE Ɛ4 carriers, right APOE Ɛ4 non-carriers. Blue, rs405509 G/G+G/T group; Red, rs405509 T/T group. Error bars represent the SE.
