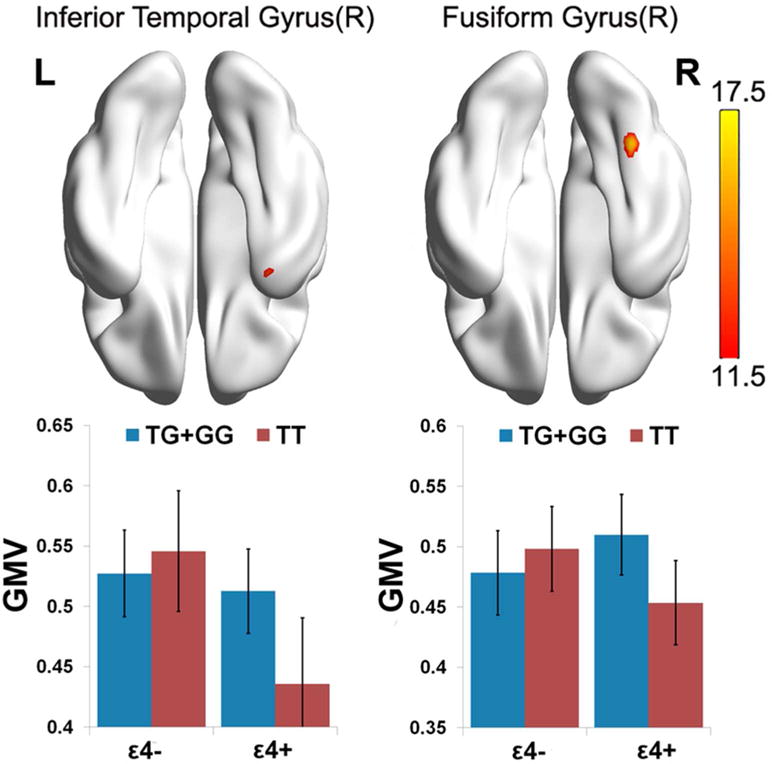
Figure 4. Interaction between rs405509 and APOE on gray matter volume.

a. Maps are displayed at a threshold of p<0.001, alphasim corrected.
b. Red: F value, showing rs405509 and APOE interaction area.
c. Bottom bar chart: Diagrams of group-specific right inferior temporal gyrus GMV and Right fusiform gyrus GMV. X axis: left, APOE ε4 carriers, right APOE ε4 non-carriers; Blue, rs405509 G/G+G/T group; Red, rs405509 T/T group.
