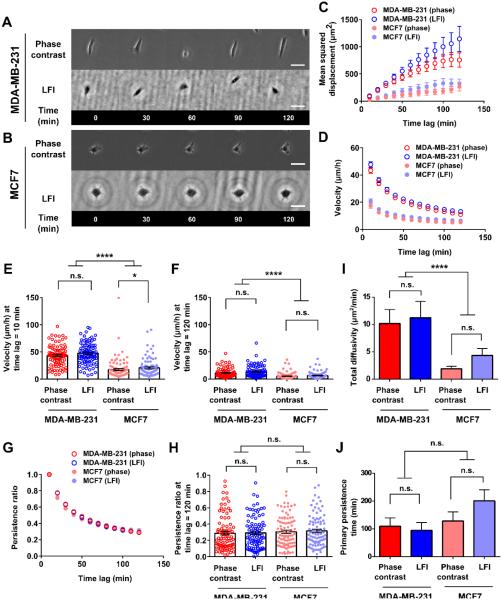
Fig. 2. Phase contrast and LFI imaging platforms generate similar results for random 2D motility assays.
Time-lapse images of (A) MDA-MB-231 and (B) MCF7 breast adenocarcinoma cells migrating on collagen type I-coated glass slides and imaged using either phase contrast microscopy (10x, 0.45 NA objective) or the LFI platform. Scale bars represent 50 μm. (C) Mean squared displacements observed for the two cell types with each imaging platform. (D) Cell velocity as a function of time lag. Velocities for time lags of (E) 10 min and (F) 120 min are also shown. (G) Persistence ratio as a function of time lag. The persistence ratio at a time lag of (H) 120 min is also shown. (I) Total diffusivity observed for the two cell types with each imaging platform. (J) Primary persistence time observed for the two cell types with each imaging platform. For all metrics, cell trajectories were tracked for the indicated time periods for up to 2 h. N=90 cells/condition, with 30 cells/experiment were analyzed from 3 independent experiments. Statistical significance between phase contrast and LFI imaging results was determined by an unpaired t test if cells passed the D’Agostino and Pearson omnibus normality test, or by Mann-Whitney test if they did not. Differences between MDA-MB-231 and MCF7 cells were assessed by Kruskal-Wallis test with Dunn’s multiple comparisons post-test. n.s., difference not statistically significant; *, p<0.05; ****, p<0.0001.

