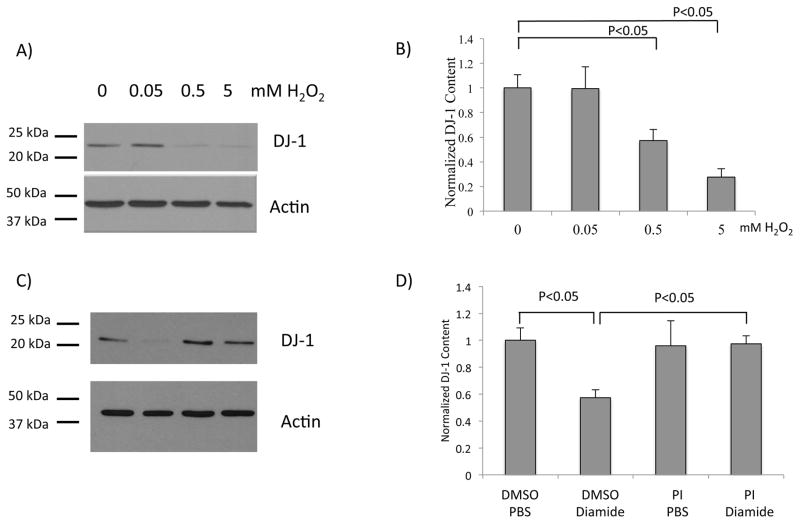
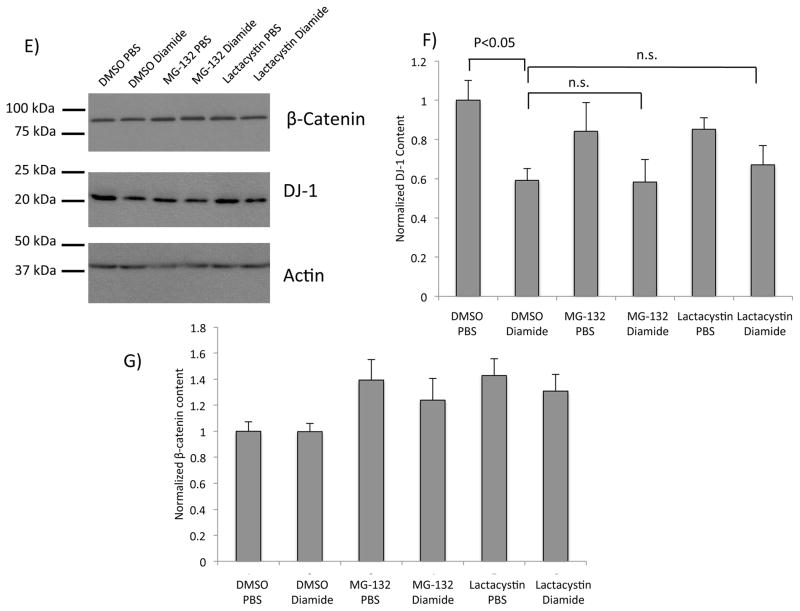
Figure 2. DJ-1 protein content is diminished after treatment with glutathionylation-inducing agents.
(A) Representative western blot analysis of lysates from SH-SY5Y cells treated with increasing concentrations of H2O2. The blot was partitioned and probed with anti-DJ-1 or anti-actin, respectively. (B) Quantification of normalized DJ-1 content after H2O2 treatment; n = 8 independent biological replicates. (C) Representative western blot analysis of lysates from SH-SY5Y cells pretreated with DMSO, or a broad protease inhibitor cocktail (PI, see Methods); then treated with PBS or 0.1 mM diamide. The blot was partitioned and probed with anti-DJ-1 or anti-actin, respectively. Lane 1, DMSO + PBS; lane 2, DMSO + diamide; lane 3, PI + PBS; lane 4, PI + diamide. (D) Quantification of normalized DJ-1 content after diamide and PI treatments; n=8 independent biological replicates. (E) Representative western blot analysis of lysates from SH-SY5Y cells pretreated with DMSO, MG-132, or lactacystin; then treated with PBS or 0.1 mM diamide. The blot was partitioned and probed with anti-β-catenin, anti-DJ-1, and anti-actin, respectively. (F) Quantification of DJ-1 protein content (normalized to actin); n = 8 independent biological replicates. Statistical analyses for quantifications shown in (B), (D), and (F) were completed using ANOVA followed by Tukey’s post hoc test. Error bars on quantification for (B), (D), and (F) represent SEM.


