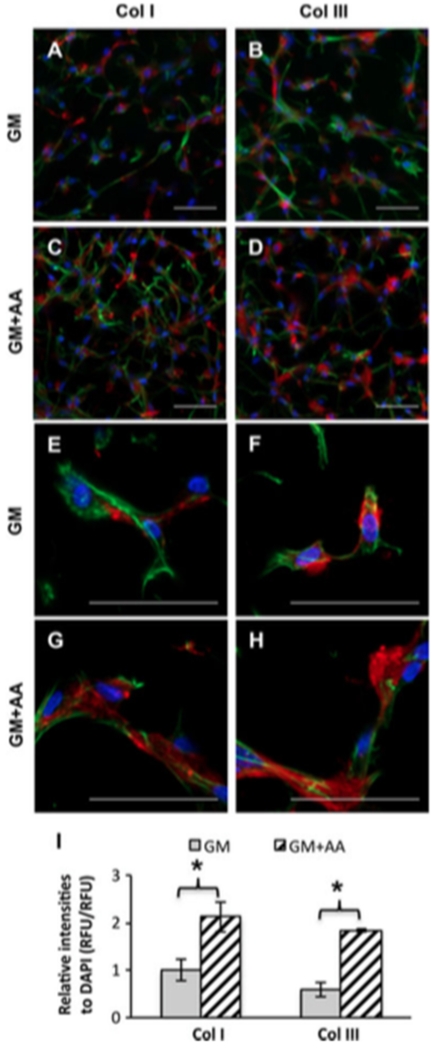
Figure 4.
AA treatment enhanced Col I and III secretion by VICs encapsulated in PEG–PQ hydrogels for 28 days. (A–H) Representative fluorescent images of Col I and Col III staining: red, Col I or III; blue (DAPI), nuclei; green (phalloidin), actin; (A, E) Col I, GM; (B, F) ColIII, GM; (C,G) ColI, GM+AA; (D,H) ColIII, GM+AA; scale bars = 50 μm. (I) Quantitative analysis based on relative fluorescence intensities of Col I, Col III and DAPI; *p < 0.01, n = 3

