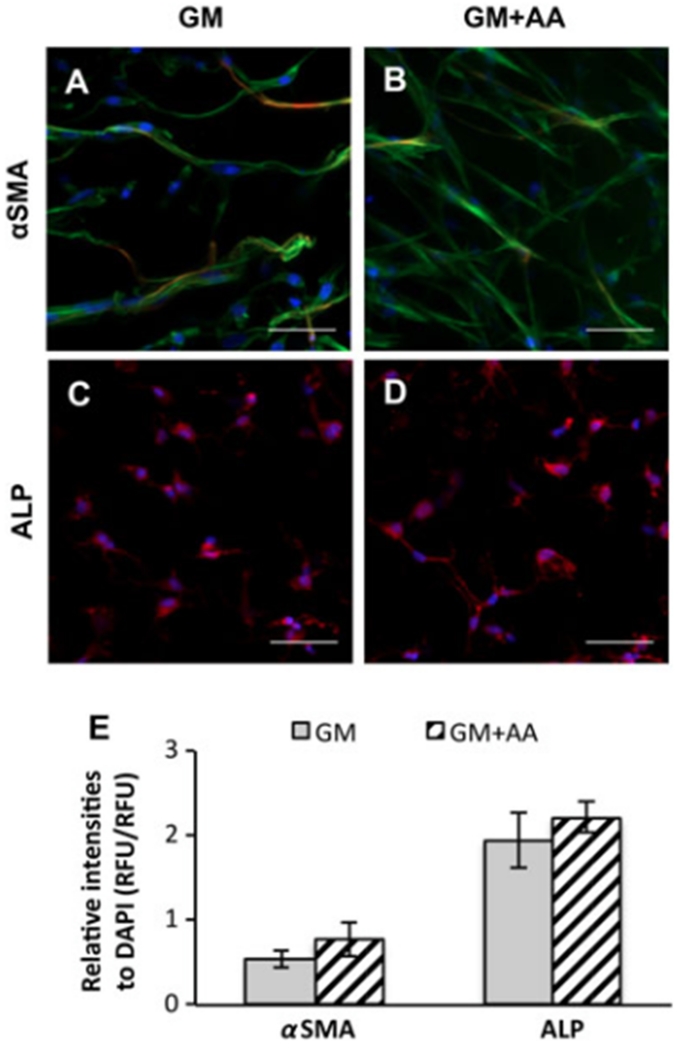
Figure 5.
AA treatment did not change the expression levels of αSMA and ALP of VICs encapsulated in PEG–PQ hydrogels. (A, B) Representative fluorescent images of αSMA staining of VICs encapsulated in (A) GM or (B) GM + AA for 21 days: red, αSMA; blue (DAPI), nuclei; green (phalloidin), actin. (C, D) Representative fluorescent images of ALP staining of VICs encapsulated in (C) GM or (D) or GM + AA for 28 days: red, ALP; blue (DAPI), nuclei; scale bars = 50 μm. (E) Relative fluorescence intensities of αSMA, ALP and DAPI; no significant difference by Student’s t-test, n = 3

