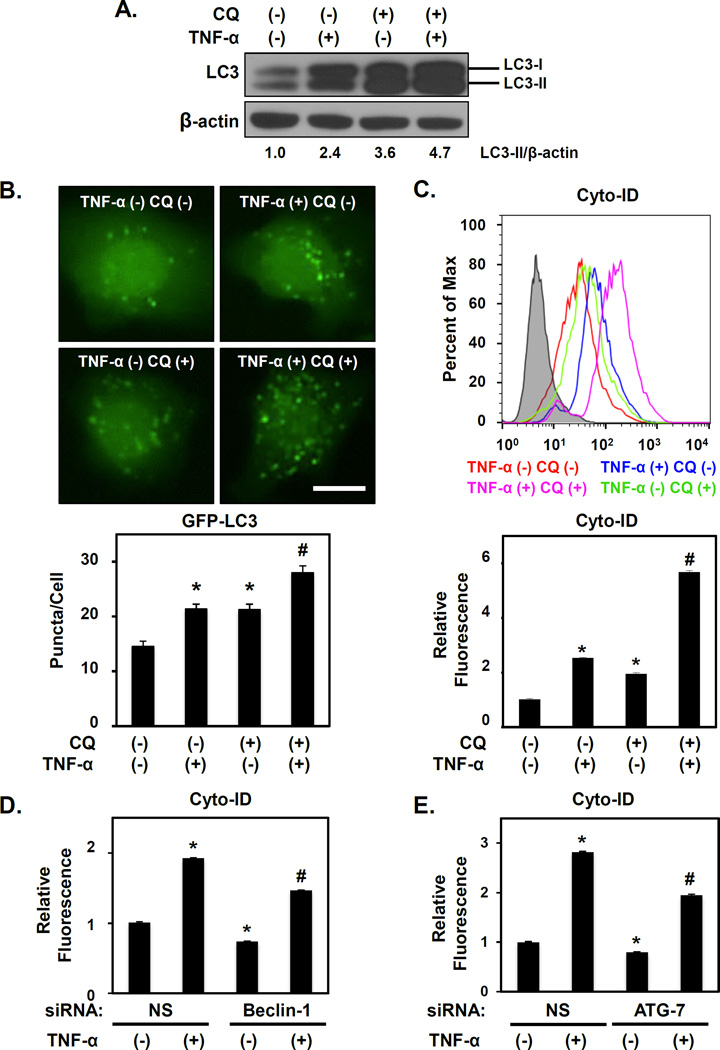
Figure 4. TNF-α activates autophagic flux in normal human oesophageal keratinocytes.
EPC2-hTERT cells were treated with 40 ng/ml TNF-α and/or 1 µg/ml CQ as indicated for 72 hours in (A)–(C); and for 72 hours following transfection with Beclin-1 siRNA, ATG-7 siRNA or non-silencing (NS) control siRNA in (D and E). Immunoblot determined LC3 (densitometry shown at bottom) with β-actin as a loading control in (A). Live cell imaging determined GFP-LC3 puncta in (B) with representative cell images (Top, Scale bar, 20µm) and average puncta/cell (Bottom). Flow cytometry determined Cyto-ID in (C–E) with representative histogram plot for each condition (Top in C) and relative Cyto-ID levels (average geometric mean)(Bottom in C). D and E. *, p<0.05; vs. TNF-α (−) CQ (−); #, p<0.05; vs. TNF-α (+) CQ (−) and TNF-α (−) CQ (+);(n=3) in (B) and (C). *p<0.05 vs. NS and TNF-α (−); #, p<0.05 vs. NS and TNF-α (+);(n=3) in (D, E). All data represent 3–5 independent experiments with similar results.

