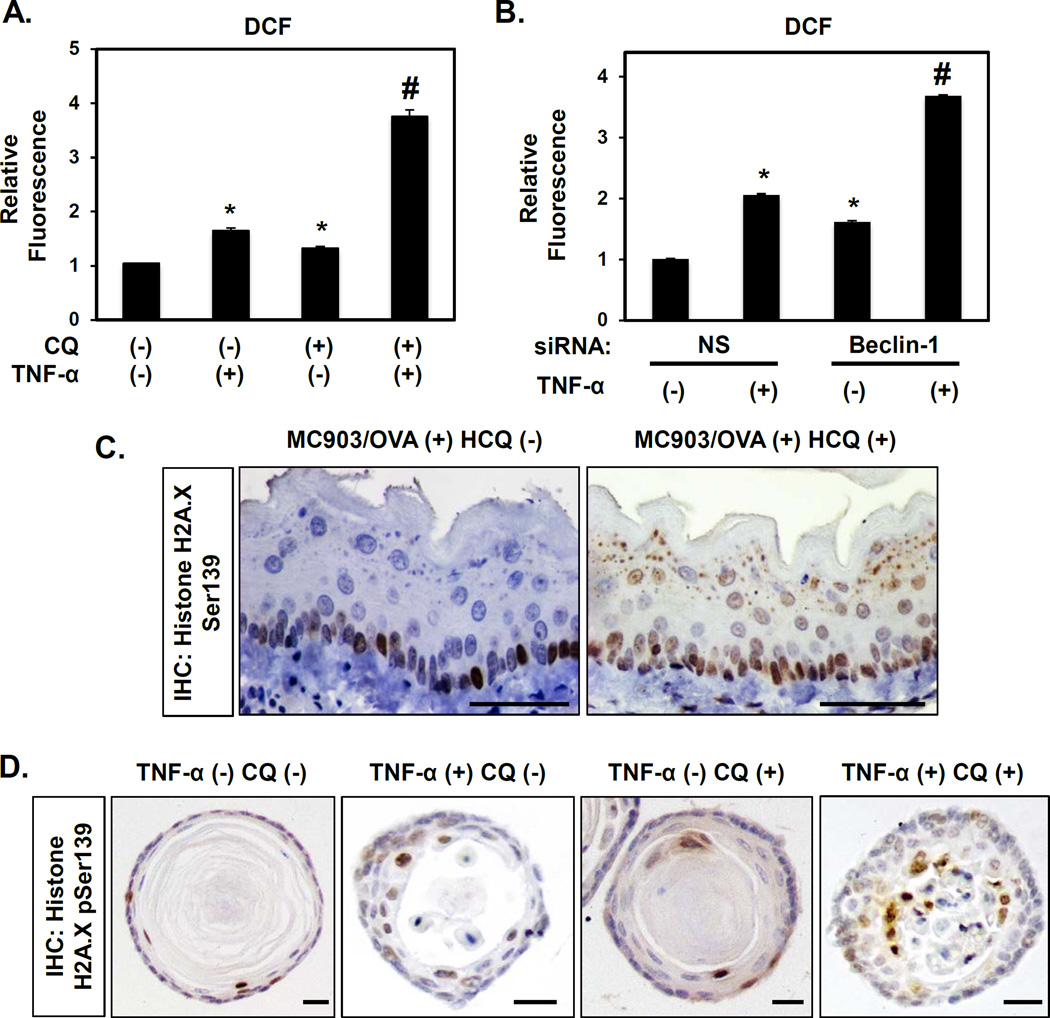
Figure 7. Autophagy inhibition promotes oxidative stress in oesophageal keratinocytes exposed to EoE-relevant inflammatory stimuli.
EPC2-hTERT cells were stimulated for 72 hours with or without concurrent 1 µg/ml CQ treatment in (A); or 72 hours following transfection with Beclin-1 siRNA or non-silencing (NS) control siRNA in (B). (A and B) Flow cytometry for DCF determined relative ROS levels. *, p<0.05 vs. TNF-α (−) and CQ (−); (n=3) in (A); and vs. NS and TNF-α (−); (n=3) in (B). #, p<0.05 vs. TNF-α (+) and CQ (−) or TNF-α (−) and CQ (+); (n=3) in (A); vs. NS and TNF-α (+); (n=3) in (B). (C) BALB/c mice were treated with MC903 and OVA for 32 days. From days 18–32, HCQ (60 mg/kg) (n=4) or vehicle (PBS) (n=7) was delivered via daily i.p. injection. Oesophageal tissues were evaluated by IHC for Histone H2A.X pSer139 (oxidative stress). Scale bars, 50 µm. (D) Murine oesophageal 3D organoids treated with or without 40 ng/ml TNF-α and/or 1 µg/ml CQ were subjected to IHC for Histone H2A.X pSer139 (oxidative stress). Scale bars, 25 µm.

