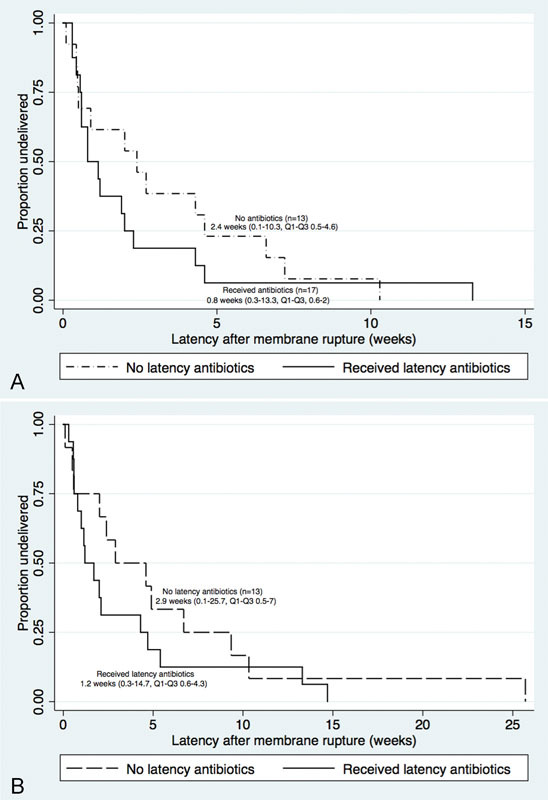
Fig. 2.

(A) Duration of Latency of rupture of membranes for twin A. Kaplan–Meier curves showing latency after rupture of membranes by receipt of latency antibiotics (n = 17) compared with nonreceipt of latency antibiotics (n = 13). This figure compares duration of latency until delivery for twin A for pregnancies complicated by previable preterm premature rupture of membranes by use or nonuse of latency antibiotics at the time of membrane rupture. (B) Kaplan–Meier curves showing latency after rupture of membranes by receipt of latency antibiotics (n = 17) compared with nonreceipt latency antibiotics (n = 13). This figure compares duration of latency until delivery for twin B for pregnancies complicated by previable preterm premature rupture of membranes by use or nonuse of latency antibiotics at the time of membrane rupture.
