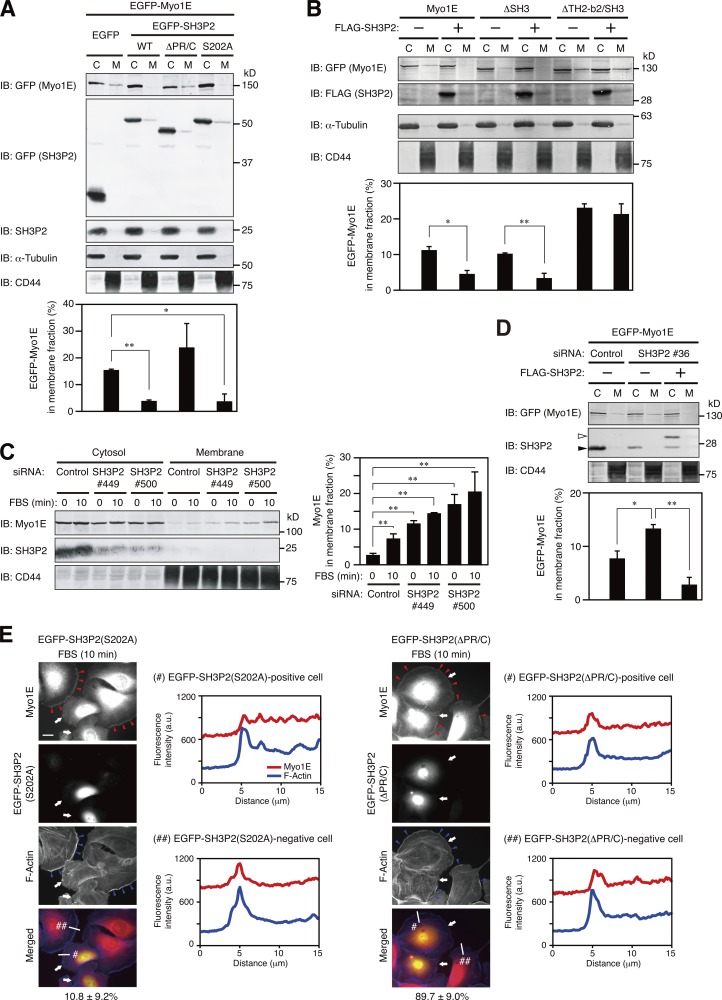
Figure 7.
SH3P2 suppresses the localization of Myo1E to lamellipodial tips. (A and B) MKN1 cells transfected for 24 h with vectors for EGFP-Myo1E and the indicated EGFP-SH3P2 constructs (WT, wild type; A) or for FLAG-tagged SH3P2 and the indicated EGFP-Myo1E constructs (B) were subjected to subcellular fractionation, and 20% of the cytosolic (C) fraction and 50% of the membrane (M) fraction were subjected to immunoblot analysis (IB) with antibodies to the indicated proteins (top). The proportion of EGFP-Myo1E constructs in the membrane fraction was determined by measurement of immunoblot intensities as mean ± SD values for three separate experiments (bottom). *, P < 0.05; **, P < 0.01. (C) MKN1 cells transfected with an SH3P2 siRNA (#449 or #500) or a control siRNA for 48 h were deprived of serum for 12 h and then stimulated with 10% FBS for 10 min. The cells were then subjected to subcellular fractionation followed by quantitative immunoblot analysis, and the proportion of Myo1E in the membrane fraction was determined, as in A and B. (D) MKN1 cells were transfected first with an siRNA targeting the 5′-UTR sequence of SH3P2 (#36) or a control siRNA for 48 h and then with vectors for EGFP-Myo1E and FLAG-SH3P2 for 24 h. The cells were subjected to subcellular fractionation followed by quantitative immunoblot analysis, and the proportion of EGFP-Myo1E in the membrane fraction was determined as in A and B. Open and closed arrowheads indicate FLAG-SH3P2 and endogenous SH3P2 bands, respectively. (E) MKN1 cells transfected with vectors for EGFP-SH3P2(S202A) or EGFP-SH3P2(ΔPR/C) for 24 h were deprived of serum for 12 h, stimulated with 10% FBS for 10 min, fixed, and stained with antibodies to Myo1E (red) and with phalloidin (blue). EGFP fluorescence was monitored directly. Red arrowheads indicate Myo1E localized to lamellipodial tips, blue arrowheads indicate lamellipodia, and white arrows indicate cells expressing EGFP-SH3P2(S202A) or EGFP-SH3P2(ΔPR/C). Bar, 20 µm. The percentages of EGFP-positive cells in which Myo1E and F-actin were colocalized are shown below the merged images as means ± SD for three separate experiments, with n ≥ 40 cells in each experiment. Fluorescence intensity profiles along the white lines in the merged images are also shown. Data are representative of at least three separate experiments.

