Figure 8.
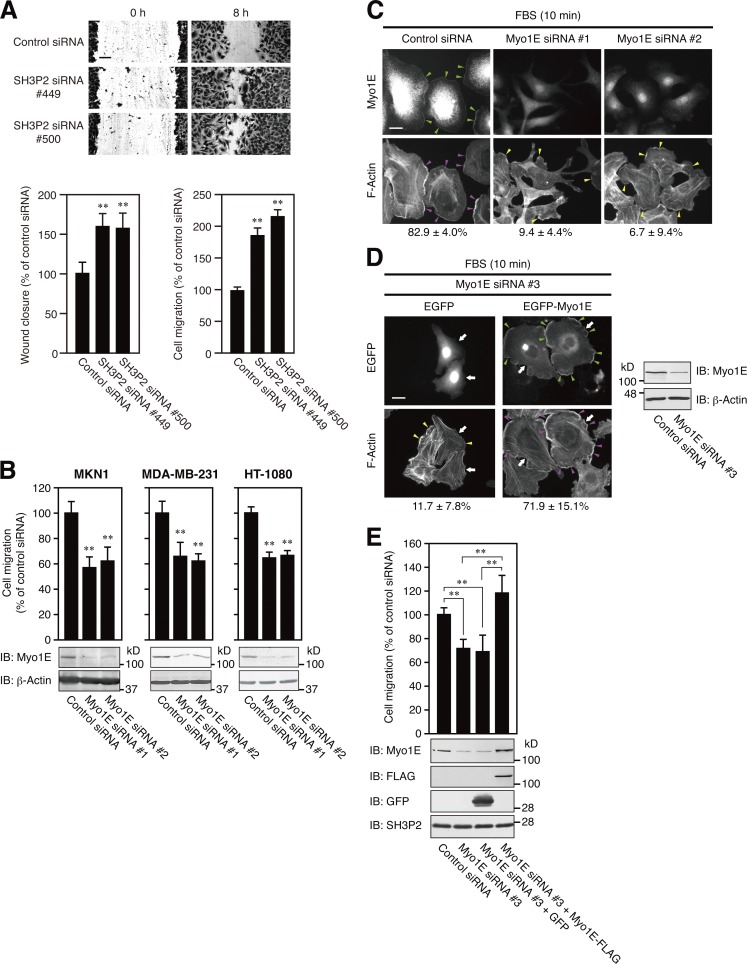
Myo1E facilitates lamellipodium formation and thereby promotes cell motility. (A) MKN1 cells transfected with an SH3P2 siRNA (#449 or #500) or a control siRNA were subjected to a wound-healing assay (top and bottom left panels) or a transwell migration assay (bottom right panel) in the presence of 10% FBS for 8 or 6 h, respectively. Bar, 100 µm. The number of cells that had migrated to reach the lower surface of the filter in the transwell migration assay was 98 ± 7 for cells transfected with the control siRNA (bottom right panel). Quantitative data are means ± SD for three separate experiments. **, P < 0.01 versus cells transfected with the control siRNA. (B) MKN1, MDA-MB-231, and HT-1080 cells transfected with a Myo1E siRNA (#1 or #2) or a control siRNA were subjected to a transwell migration assay in the presence of 10% FBS for 6 h. Cell lysates were also subjected to immunoblot analysis (IB) with antibodies to Myo1E and to β-actin (loading control). The numbers of cells that had migrated to reach the lower surface of the filter were 159 ± 17, 166 ± 15, and 288 ± 12 for control siRNA–transfected MKN1, MDA-MB-231, and HT-1080 cells, respectively. Quantitative data are means ± SD for three separate experiments. **, P < 0.01 versus cells transfected with the control siRNA. (C) MKN1 cells transfected with a Myo1E siRNA (#1 or #2) or a control siRNA for 48 h were deprived of serum for 12 h, stimulated with 10% FBS for 10 min, fixed, and stained with antibodies to Myo1E and with phalloidin. Green arrowheads indicate Myo1E localized to lamellipodial tips, magenta arrowheads indicate extended lamellipodia (total length of >50 µm per cell), and yellow arrowheads indicate immature lamellipodial structures (total length of <50 µm per cell). Bar, 20 µm. The percentages of cells with extended lamellipodia are shown below the images as means ± SD for three separate experiments, with n ≥ 60 cells in each experiment. (D) MKN1 cells were transfected first with an siRNA targeting the 5′-UTR sequence of Myo1E (#3) for 48 h and then with a vector for EGFP or EGFP-Myo1E for 24 h. The cells were then deprived of serum for 12 h, stimulated with 10% FBS for 10 min, fixed, and examined for EGFP fluorescence and stained with phalloidin. Green arrowheads indicate Myo1E localized to lamellipodial tips, magenta arrowheads indicate extended lamellipodia (total length of >50 µm per cell), yellow arrowheads indicate immature lamellipodial structures (total length of <50 µm per cell), and white arrows indicate cells positive for EGFP or EGFP-Myo1E. Bar, 20 µm. The percentages of EGFP-positive cells with extended lamellipodia are shown below the images as means ± SD for three separate experiments, with n ≥ 40 cells in each experiment. Cell lysates were also subjected to immunoblot analysis with antibodies to Myo1E and to β-actin. Data are representative of at least three separate experiments. (E) MKN1 cells were transfected with an siRNA targeting the 5′-UTR sequence of Myo1E (#3) for 24 h, infected with lentiviruses encoding GFP or Myo1E-FLAG for 24 h, and then cultured in fresh medium for 24 h. The cells were subjected to a transwell migration assay in the presence of 10% FBS for 6 h. Cell lysates were also subjected to immunoblot analysis with antibodies to the indicated proteins. The number of cells that had migrated to reach the lower surface of the filter was 205 ± 15 for control siRNA–transfected MKN1 cells. Quantitative data are means ± SD for three separate experiments. **, P < 0.01.

