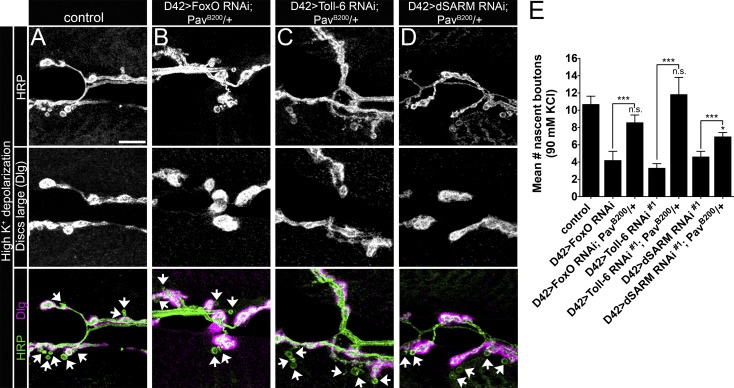
Figure 6.
pav dominantly suppresses structural plasticity defects observed with loss of Toll-6, foxO, or dSARM function. (A–D) Representative confocal projections of NMJ6/7 in A2 and A3 labeled with HRP and Dlg after high K+ stimulation. Arrows denote nascent boutons. Bar, 10 µm. (E) Quantification of nascent boutons. Control90mM: 10.7 ± 1.0 (n = 24); D42>dcr-2; foxO RNAi90mM: 4.2 ± 1.1 (n = 17); D42>dcr-2; foxO RNAi; PavB200/+90mM: 8.6 ± 0.9 (n = 20); D42>dcr-2; Toll-6 RNAi#190mM: 3.3 ± 0.5 (n = 18); D42>dcr-2; Toll-6 RNAi#1; PavB200/+90mM: 11.8 ± 2.0 (n = 21); D42>dcr-2; dSARM RNAi#190mM: 4.6 ± 0.7 (n = 29); and D42>dcr-2; dSARM RNAi#1; PavB200/+90mM: 6.9 ± 0.5 (n = 23). Control is D42>dcr-2; PavB200/+. Error bars are mean ± SEM. n.s., not significantly different from control90mm. *, P < 0.05; ***, P < 0.001. Statistical comparisons above individual bars are made to the control.

