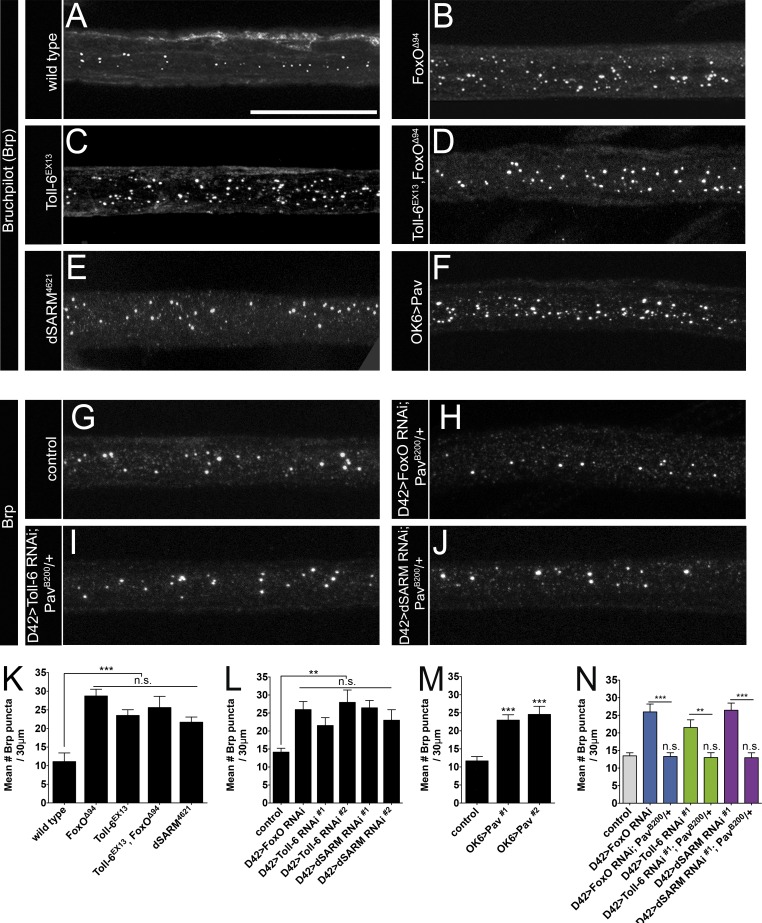
Figure 8.
Elevated MT stability impairs axonal transport in Toll-6 pathway mutants. (A–J) Representative confocal projections of L3 nerves of indicated genotypes labeled with anti-Brp. Bar, 20 µm. (K) Quantification of Brp accumulations per 30 µm of nerve. Wild type (OregonR): 11.1 ± 2.3 (n = 20); foxOΔ94: 28.7 ± 1.8 (n = 50); Toll-6EX13: 23.5 ± 1.5 (n = 52); Toll-6EX13, foxOΔ94: 25.6 ± 3.0 (n = 34); and dSARM4621: 21.7 ± 1.4 (n = 35). (L) Quantification of Brp accumulations per 30 µm of nerve. Control (D42>dcr-2): 14.1 ± 1.1 (n = 52); D42>dcr-2; foxO RNAi: 26.0 ± 2.2 (n = 25); D42>dcr-2; Toll-6 RNAi#1: 21.5 ± 2.2 (n = 17); D42>dcr-2; Toll-6 RNAi#2: 28.0 ± 3.4 (n = 20); D42>dcr-2; dSARM RNAi#1: 26.4 ± 2.0 (n = 27); and D42>dcr-2; dSARM RNAi#2: 23.0 ± 2.9 (n = 22). (M) Quantification of Brp accumulations per 30 µm of nerve. Control (D42>dcr-2; PavB200/+): 11.7 ± 1.2 (n = 24); OK6>Pav#1: 23.0 ± 1.5 (n = 21); OK6>Pav#2: 24.6 ± 2.2 (n = 33). Control is OK6Gal4/+. (N) Quantification of Brp accumulations per 30 µm of nerve in control: 13.5 ± 0.9 (n = 39); D42>dcr-2; foxO RNAi: 26.0 ± 2.2 (n = 25); D42>dcr-2; foxO RNAi; PavB200/+: 13.3 ± 1.1 (n = 24); D42>dcr-2; Toll-6 RNAi#1: 21.5 ± 2.2 (n = 17); D42>dcr-2; Toll-6 RNAi#1; PavB200/+: 13.0 ± 1.4 (n = 18); D42>dcr-2; dSARM RNAi#1: 26.4 ± 2.0 (n = 27); and D42>dcr-2; dSARM RNAi#1; PavB200/+: 13.0 ± 1.4 (n = 22). Error bars are mean ± SEM. n.s., not significantly different. **, P < 0.01; ***, P < 0.001.

