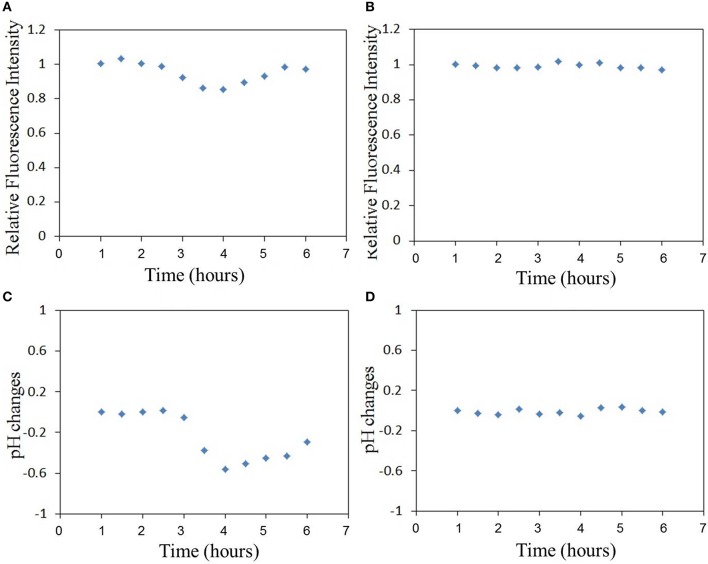
Figure 4.
The relative fluorescence intensity changes of FITC of the sensor adhered to (A) virus-bound cell and (B) virus-unbound cell, and the pHe changes of (C) virus-bound cell and (D) virus-unbound cell calculated basing on the fluorescence changes in (A,B), (Time-course measurements are initiated post-virus binding to the cell membrane).

