Figure 1.
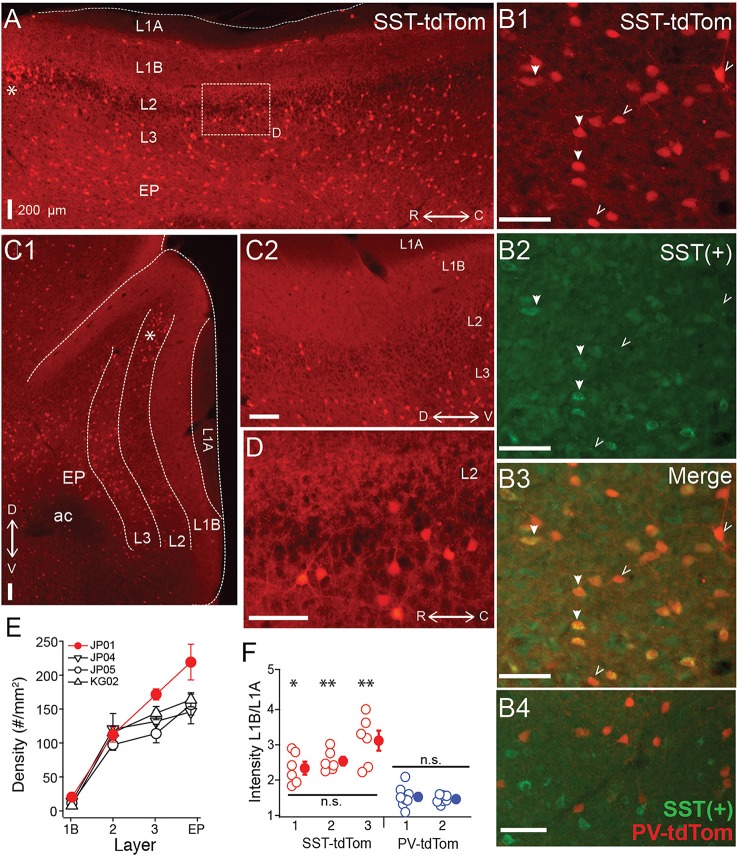
Distributions of SST-cre cells in anterior piriform cortex. (A) Sagittal section of anterior piriform cortex from an SST-tdTom mouse (mouse #JP01). Lamina are labeled (L1A, L1B, L2, L3, EP), asterisk (*) corresponds to dorsal/rostral L2 density of SST-cre cells. 4x magnification, Scale bar: 200 μm. (B) Co-expression of SST-tdTom cells with anti-somatostatin immunolabeling [SST(+), green]. SST(+) cells are shown with filled arrows while SST(−) cells are labeled with open arrows (20x, scale bars 100 μm; B1) SST-tdTom expression (red; B2) SST-immunolabeling (green; B3) Merge of (B1,B2) showing co-expression (yellow). (B4) Minimal overlap of PV-tdTom (red, mouse KM04) and SST(+) cells (green). (C1) Coronal section from opposite hemisphere of mouse #JP01 shown in (A). Labels as in (A), 4x magnification, Scale bar: 200 μm. (C2) Enlarged (10x) area of (C1) showing tdTom fluorescence in L1B corresponding to projections from SST-cells. Scale bar: 200 μm. (D) Enlarged (20x) area of box shown in (A). Scale bar: 100 μm. (E) Average density of SST-cells in each layer for four different mice from two different litters (denoted JP, KG). Points shown in red correspond to data from mouse #JP01 shown in panels (A) and (C1,C2). (F) Ratio of fluorescence in L1B:L1A for three SST-tdTom mice and two PV-tdTom mice. Each point corresponds to one coronal section. The fluorescence ratio did not significantly differ between SST-tdTom mice but was significantly higher in individual SST-tdTom vs. PV-tdTom mice (*p < 0.05; **p < 0.01, ANOVA-Welch). ac, anterior commissure.

