Figure 3.
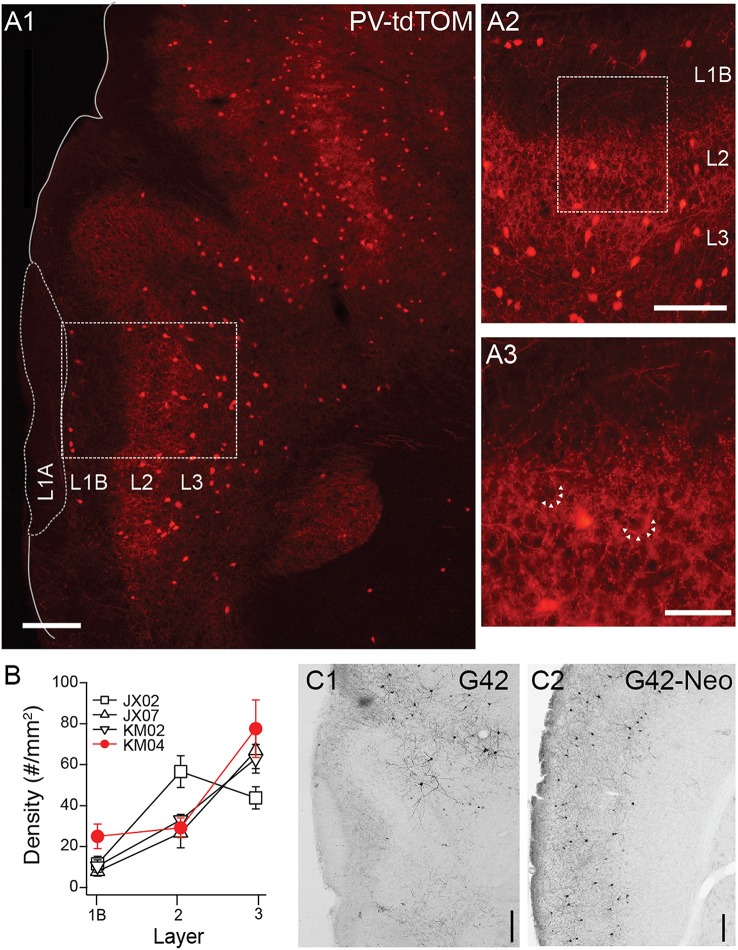
Distributions of PV-cre cells in anterior piriform cortex. (A1) Coronal section from a PV-tdTom mouse (KM04). 4x magnification, Scale bar: 200 μm. (A2) Enlarged (10x) area of A1 showing a lack tdTom fluorescence in L1B but strong fluorescence in L2. Scale bar: 100 μm. (A3) Enlarged (20x) area of box shown in (A2). Note punctate tdTom fluorescence outlining dark voids (arrows) suggestive of basket synapses. Scale bar: 50 μm. (B) Average density of PV-cells in each layer for four different mice from two different litters (denoted JX, KM). Points shown in red correspond to data from mouse KM04 shown in panels (A1–A3). (C) Anti-GFP labeling in coronal sections from a G42 mouse (C1) APC (C2) Neocortex (Neo). 4x magnification, Scale bar: 200 μm.

