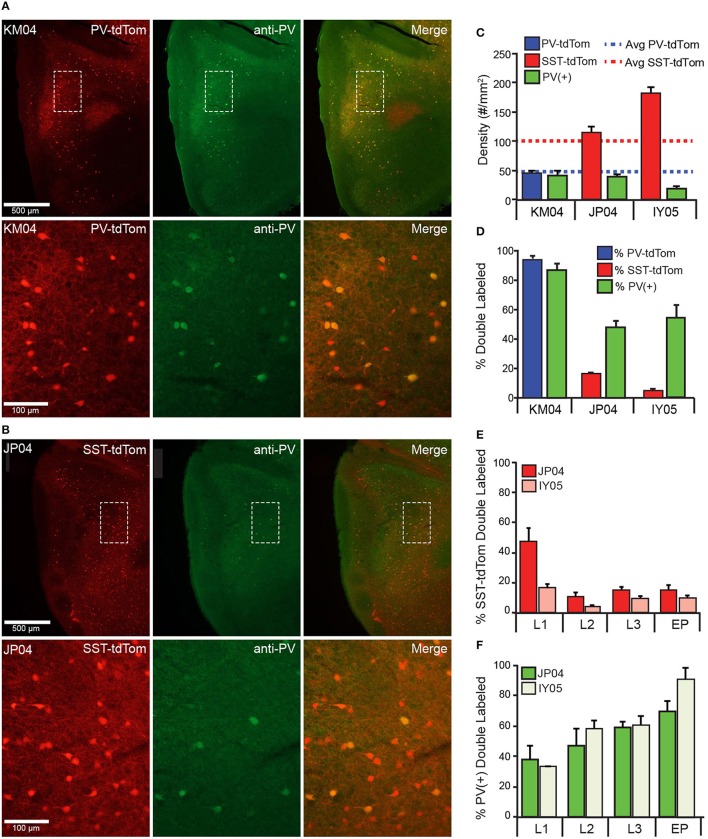
Figure 4.
Co-expression of parvalbumin and tdTomato in PV-Cre and SST-Cre lines. Anti-parvalbumin immunostaining in (A) PV-tdTom mouse (KM04) and (B) SST-tdTom mouse (JP04). Sections from both animals were stained in the same experiment. Upper panels show the APC (4x magnification), lower panels show area indicated by dashed box at higher magnification (20x) Left panels: tdTom(+) neurons (red) in the PV-tdTom (A) or SST-tdTom (B) animals; middle panels: PV(+) interneurons labeled with GFP (green); and right panels: co-expression tdTom(+) and PV(+) cells (yellow). (C) Density of tdTom(+) cells in the PV-tdTom (KM04, blue) and two SST-tdTom (JP04, red; IY05, pink) mice. Dashed lines correspond to average densities of tdTom(+) cells reported for all SST-tdTom (red) and PV-tdTom (blue) mice. The green bars correspond to the density of PV(+) cells in each mouse. (D) Co-expression of PV(+) and tdTom(+) as a percentage of tdTom(+) cells in PV-tdTom (blue) or SST-tdTom (red) mice or as a percentage of PV(+) cells (green) in each mouse. (E) Co-expression of PV(+) and tdTom(+) as a percentage of tdTom(+) cells in SST-tdTom mice (JP04 red, IY05 pink) by layer. (F) Co-expression of PV(+) and tdTom(+) as a percentage of PV(+) cells in SST-tdTom tissue (JP04 dark green, IY05 light green) by layer.

