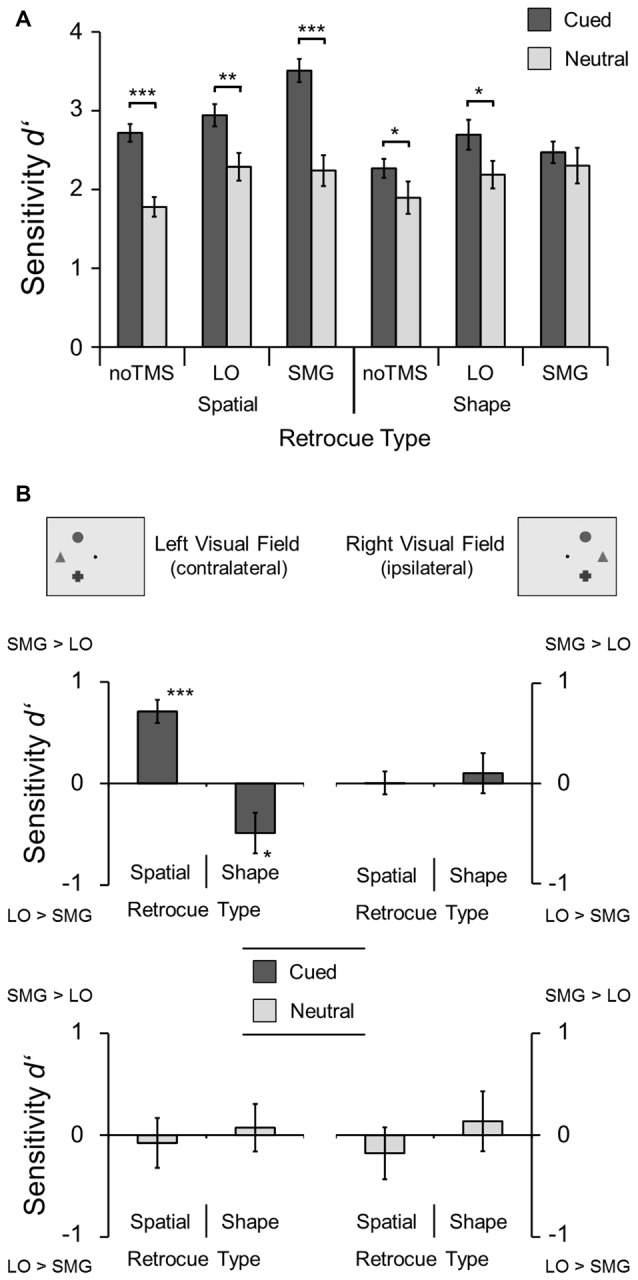
Figure 3.

Results of the main experiment. (A) Sensitivity of change detection (d′) shown for the different retrocue types and TMS conditions. Asterisks mark significant differences between cued and neutral trials (*p < 0.05; **p < 0.01; ***p < 0.001; one-tailed t-tests). (B) Differential effects of the two TMS sites relative to the no-TMS baseline (SMG minus LO), shown separately for left- and right-hemifield trials and for cued (dark gray, upper row) and for neutral trials (light gray, bottom row). Positive values indicate improved performance with TMS to SMG, negative values indicate improved performance with TMS to LO. Asterisks mark significant differences from zero (two-tailed t-tests). Error bars show standard errors of the means.
