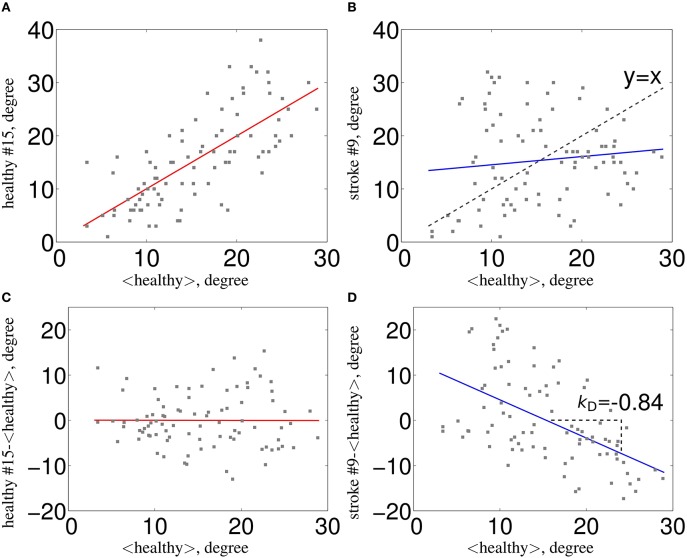
Figure 1.
Estimation of κ. The nodal network topology (here, node degree) of an individual subject in relation to the normative network topology of the healthy control group (A) for one healthy volunteer and (B) for one stroke patient. To construct the hub disruption index κ for the degree, we subtract the healthy group mean nodal degree from the degree of the corresponding node in an individual subject before plotting this individual difference against the healthy group mean. κ is the slope of the regression line computed on this scatter plot. This transformation means that the data for an individual healthy volunteer (C) will be scattered around a horizontal line (κ~0), whereas the data for a patient in a stroke (D) will be scattered around a negatively sloping line (κ < 0).

